“How can Canvas help me analyze how my students are doing?”
Analytics Beta is a new Canvas tool that provides better analytics for tracking student data. It has an interactive chart or table which allows you to customize views of data and filter for specific items. You can use it to track how your students are doing in the class as a whole, in a specific section, or on a particular assignment, or even track individual students. You can even compare the student to the section, and the whole class in one view. Analytics also helps you quickly identify and contact students who might need extra help or attention.
Turning Analytics Beta On
Analytics Beta is designed as a Course Navigation link that is only visible to admins, instructors, TAs, and designers. Students will not be able to see analytics. To view Analytics Beta, the Analytics Beta navigation link must be enabled in the Navigation page in Course Settings. Making the link visible in the course does not display the link to students or observers. To enable anonymous grading:
1. Login to Canvas.
2. Navigate to a course.
3. In Course Navigation, click the Settings link.
4. Near the top, in the center, click the Navigation tab.
5. Find the Analytics BETA item.
6. Click the three buttons to expand options.
7. Click Enable.
8. Remember to scroll to the bottom and click the Save button!
Course Grade is the first feature available within Analytics Beta. Course Grade allows instructors to view the average course grade for all course data using an interactive chart or table. Additionally, instructors can filter analytics results to compare the average course grade with a specific section, student, or assignment.
The analytics page is dynamic and can show various filtered content; however, a maximum of three filters can be applied at once. The tabs above the chart show the filters you have selected, making it easy to switch among the different filters.
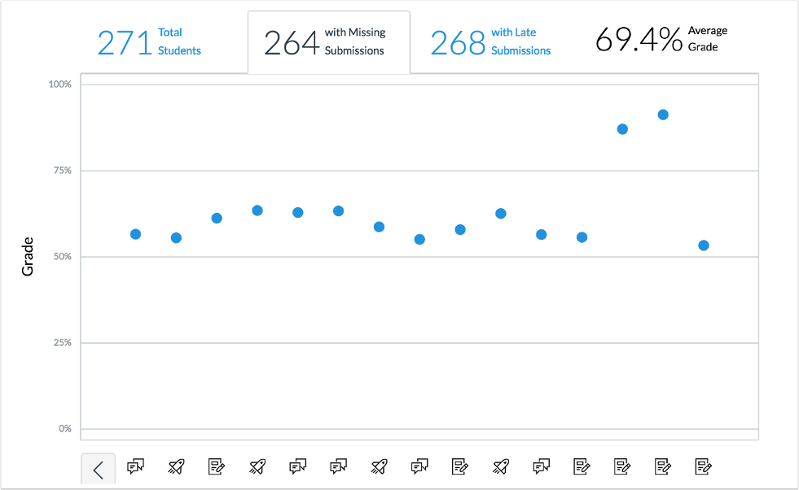
View of Analytics page with filters applied
If you want to dive into a specific point and see details, just click on any of the data points. A summary card will pop up and show detailed metrics for the assignment.
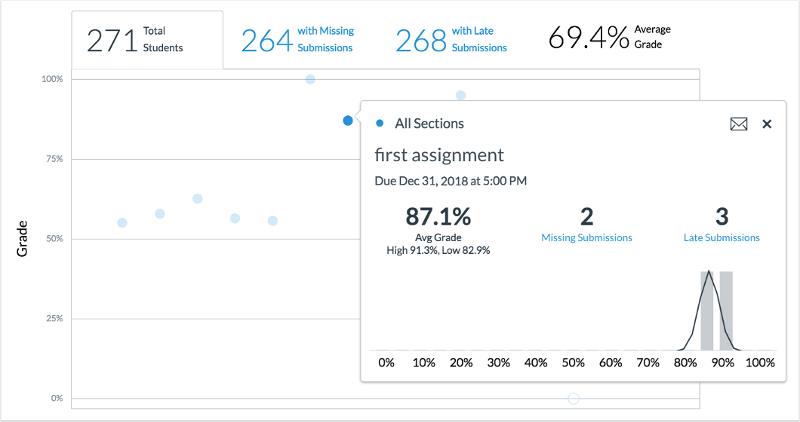
Pop-up summary card showing detailed metrics for an assignment
You can also view the data as a data table by percentage instead of a chart by clicking the Data Table option within the Chart Options menu.
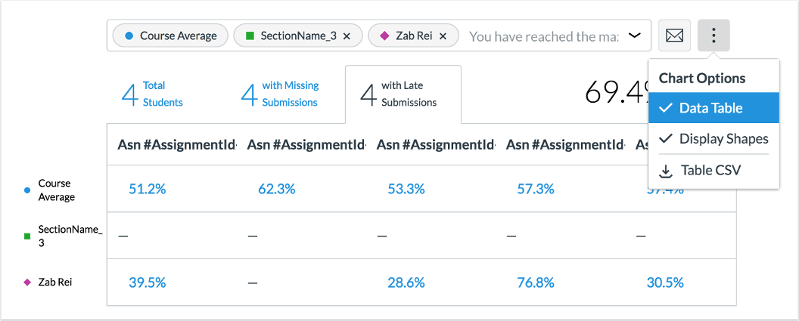
Data shown as percentages by selecting Data Table option
Under the data tables you have a second table called the Student Table. This displays all students within the filters you chose. The table is sorted alphabetically by last name by default; however, you can sort any column by clicking on the header. Also, by default the student table only lists five students at a time, but you can click the preferred number of students to display per page in the top right-hand corner of the table. The table will display the student’s
- name;
- overall course grade;
- overall percentage of on-time assignment submissions;
- last interaction time;
- last activity time.
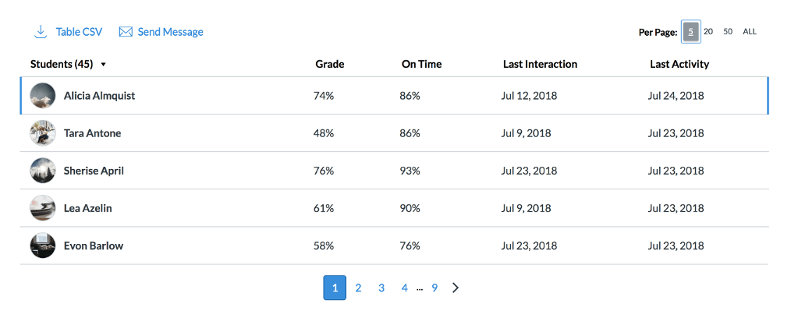
Student Table in Analytics Beta
You can also message students through analytics. This will allow you to select students whose grades or submissions fall within specific criteria. For example, you can message all students who have grades below a certain percentage, or all students who have failed a quiz. The selection criteria can be applied to students’ performance on all assignments or a single assignment. The student selection is based on student scores and submission status. All students can be messaged at one time. To message students:
1. Click on the Send Message link.
2. Select the criteria tab by which you want to select students. Note: If you select Score Range, you must enter a minimum and maximum percentage.
3. Select the sections or students you want to blind carbon copy.
4. Type your message.
5. Click Send.
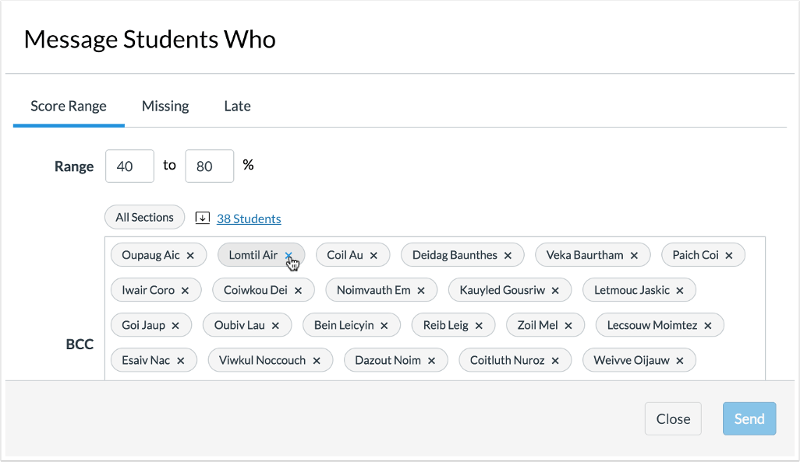
Interface for messaging students in Analytics Beta
Further Resources and Getting Help
For detailed information on the new analytics tool, see:
If you need additional help with Analytics Beta, or if you have any other questions, Academic Technology Solutions is happy to help. You can attend one of our walk-in sessions held in the TechBar of the Regenstein Library (see our workshop schedule for upcoming sessions), or contact us to schedule a consultation.