Smart Store: Track your store like you would track the vitals of a patient in surgery

You think the shopper is smart?

With the rise in consumer preferences towards natural, organic and non-GMO food, retailers are faced with the challenge of supplying fruits, vegetables, and protein with a shorter shelf life, and adjusting to these trends of a dynamic marketplace.  86% of shoppers are confident the food they buy is safe from germs and toxins, down from 91% in 2014.  Retailers must become more operationally efficient or increase their stock to overcompensate for higher rates of spoilage in order to counteract shorter shelf life challenges.  Planning for fresh produce is more complicated than for non-perishable goods. According to a BlueYonder study, 68% of shoppers feel disappointed with the freshness of their purchases, and 14% of shoppers seek organic certification.

By using machine learning solutions, retailers will be able to optimize the environmental conditions affecting spoilage. In addition, there are risks of being out of compliance on food, health and environmental safety regulations with very high penalty, like Walmart paid $81M in environmental compliance.

How can you keep up?

Grocery retailers generally have low profit margins, so slight improvements to efficiency are important.  Our machine learning solution is aimed at helping retailers improve their management of shorter shelf life products, and ultimately their profitability through optimization of their energy cost and prediction of temperature control equipment failure.  

  • Energy Savings:  In some cases, utilities can amount to up to 50% of profit margin for a store, and energy savings driven by machine learning translate immediately to profit margins.  For example, within the perishable seafood or meat sections, overcooling is a significant cost that can automatically be optimized by sensors that measure temperature in a cooler or refrigerator.
  • Effectivity and Efficiency:  Better allocation of resources like people and machines is very useful for top and bottom line. E.g. out of stock inventory can lead to $24M lost sales per $1B retail sales. Automatic tracking of inventory levels can help increase productivity and also revenues.
  • Predictive Maintenance:  Because refrigeration equipment has to run 24 / 7, there are high breakdown rates of equipment.  Sensing equipment can be applied to HVAC and Nitrogen equipment to predict failure ahead of time.  Even just small freeze / thaw cycles can quickly damage product and lead to waste for retailers.
  • Compliance: FSMA and EPA includes multiple guidelines for retailers and grocery stores to follow, with high penalties for out of compliance.
  • Consumer behavior: Consumer preferences and potential trends can be identified and acted upon if predicted. The Amazon store could even track which products you are interested in, but  had not purchased.
  • Risk mitigation: We could observe financial transactions, customer behavior etc. to predict risks, fraud, shoplifting etc. automatically and proactively.

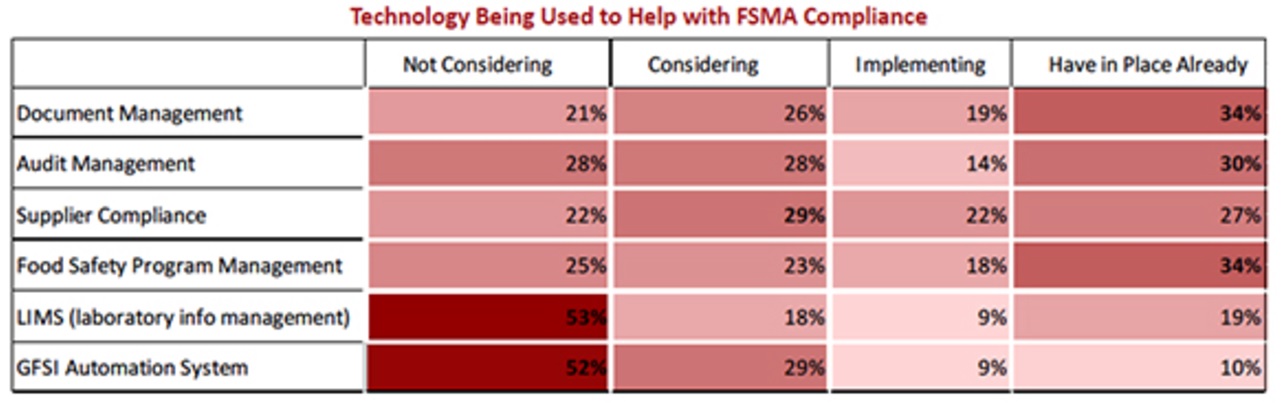
Organizations are already moving to smarter technology for help.


What if the store was also smart?

Grocery retailers could use advanced analytics through IOT and other technology to revamp the way they monitor their stores.

  1. Video feeds
  2. Point Of Sale sensors
  3. Mobile phones / equipment of Associates in store
  4. IR Motion Sensors
  5. HVAC and Energy monitoring using sensing of temperature, pressure, humidity, Carbon Monoxide
  6. Weight Mats
  7. Parking Space sensor
  8. Digital Signage
  9. Gesture Recognition/ accelerometers
  10. Door Hinge Sensor motion/ pressure
  11. Wifi Router and connections
  12. Shelf Weight
  13. Air Filter/humidity
  14. Lighting
  15. Electricity, Water, gas meters
  16. Spark (Temperature) for places this device is taken to

Example use cases:

  1. Predictive Device Maintenance to avoid compliance lapse (e.g. Fridge for Food Safety, Fire Safety equipment, lighting, etc.)
  2. Hazard detection and prevention through monitoring of toxic substance spill and disposal (air filter, shelf weight and video sensor)
  3. FSMA compliance across labels, food expiry, storage conditions, etc.
  4. Health safety with store conditions like canopy use, weather, leaks etc.
  5. Temperature, defrost and humidity monitoring for Ice-cream, meat, dairy, and pharmaceuticals
  6. Video analysis to predict long lines and avoid bad customer experience or lack of lost customers increased productivity etc. by alerting and optimizing resource allocation
  7. Video + Point Of Sale analysis for fraudulent transactions avoidance

A central monitoring within stores, and centrally can be created, to mimic the NASA base in Houston, is always able to support all adventurers within the store. Roger that?

_____________________________________________________________

Team – March and the Machines

Ewelina Thompson, Akkaravuth Kopsombut, Andrew Kerosky, Ashwin Avasarala, Dhruv Chadha, Keenan Johnston

_____________________________________________________________

Sources:
  1.  FMI U.S. Shopper Trends, 2016. Safe: A32. Fit health: A12. Sustain health: A9, A12. Community: A12, * The Hartman Group. “Transparency”, 2015.
  2. http://www.cnsnews.com/news/article/wal-mart-pay-81-million-settlement-what-epa-calls-environmental-crimes
  3. https://www.slideshare.net/vinhfc/out-of-stock-cost-presentation
  4. https://www.fda.gov/food/guidanceregulation/fsma/
  5. https://www.epa.gov/hwgenerators/hazardous-waste-management-and-retail-sector
  6. Amazon store – https://www.youtube.com/watch?v=NrmMk1Myrxc
  7. https://foodsafetytech.com/tag/documentation/


TalentSafe: Secure your firm’s talented workforce!

“The average worker today stays at each their job for 4.4 years, according to data from the Bureau of Labor Statistics, but the expected tenure of the youngest employees is half that.” – Forbes 2016

TalentSafe leverages signals from all over the workplace to predict who is at risk of attrition and how to maintain a healthy team.

The break up:

Quitting a job or firing someone is gruelling. However, not all turnover is bad. High employee-retention rate can be evidence of productivity, or alternatively suggest a culture of entitlement or one that fails to challenge employees. There is a healthy, ideal turnover rate applicable to different organizations.

The problem is not small. The potential benefits are massive.  

The real problem is how to increase the retention rate of high performance employees and maintain healthy retention rate of other employees.  

Solution:

Accurate predictions enable organizations to take action for retention or succession planning of employees. To solve this problem, organizations can use academic research backed machine learning techniques[2] to predict employee turnover. However, no solution exists in the market because of a few gaps that can be addressed.

Fix data gaps:

Modeling data, a big issue, comes from HR Information Systems (HRIS), which are typically underfunded compared to other Information Systems in the organization. This creates noise in the data that renders predictive models prone to inaccuracies. Studies[4] use Extreme Gradient Boosting (XGBoost) to improve predictions from the data.

TalentSafe can use data and signals from different sources, such as:

  • Baselines from interview process and past experience, using studies[5]
    • Biodata
      • Employee reference
      • Prior job length
    • General work-related attitudes
      • Self-confidence
      • Decisiveness
      • Perseverance
    • Job-specific attitudes
      • Desire for the job
      • Overt intent to quit
    • Personality traits
      • Conscientiousness
      • Emotional stability
  • Sources of data during the job
    • Behavioral and attitudinal
      • Emails
      • Messages
      • Office phone conversation
      • Web browsing behavior
      • Applications usage
      • Job search history
      • Meeting attendance, cancellations
      • Reimbursements
    • Human responses
      • Survey feedback from employees, peers, managers, customers
    • HR information systems
      • Performance ratings
      • Performance reviews
      • Salary/raise
      • Leaders’ feedback
      • Employees’ self assessment
    • Machine sensors
      • Audio detection, video detection, and facial detection from camera
  • Measuring
    • Responses – Responsiveness, timeliness, positive/negative emotions
    • Motivation – self and others
    • Happiness at work place[6] using computer and other systems usage
    • Engagement/involvement in work related social events

Value of each attrition is different. The departure of VP of Sales has a very different impact compared to an analyst’s.

Benefits > Costs = functional turnover

Costs > Benefits = dysfunctional turnover

TalentSafe’s solution would assess information from all sources to understand sentiments, engagement, and emotions to

  • Predict attrition risk
  • Assess value of employees
  • Recommend the right action plan, and address long term trends and dysfunctions

* value to organization is subject to measurement process like performance metrics

Demonstration / Pilot

Objective: Predict turnovers, understand if the turnover is good or bad, and what kind of action to take.  The pilot will be tested in three ways.


  • Out of sampleTalentSafe will take all relevant data from a target firm for the previous year including people who stayed and who left. The models will be built on 70% of training data, and 30% testing data
  • Out of timeFor the same firm, TalentSafe will model using 2016 data and predict on 2017 data
  • Real time sampleTalentSafe will cluster different branches of the same organization based on their overall performance and attrition rates & quality. Within each cluster, branches will be randomly assigned into test and control. Nothing changes for control branches, but we implement TalentSafe in test branches to measure the  attrition rates and performance before and after implementation.

In all three cases, the assessment will be across metrics of attrition size, quality and performance, in a confusion matrix[7] comparing estimated and actuals.


Once the sources of problems are identified it becomes important to address the root causes. Are there systematic dysfunctions[8] in management/leadership, policies, process, compensation, people etc. that need to be addressed?

— Ewelina Thompson, Akkaravuth (March) Kopsombut, Andrew Kerosky, Ashwin Avasarala, Dhruv Chadha, Keenan Johnston

_____________________________________________

1. http://www.hrvoice.org/the-mystery-of-the-ideal-turnover-rate/
2. https://www.techemergence.com/machine-learning-in-human-resources/
3. https://business.udemy.com/blog/the-next-wave-of-predictive-analytics-in-hr-5-tips-for-success-in-2017/
4. https://thesai.org/Downloads/IJARAI/Volume5No9/Paper_4-Prediction_of_Employee_Turnover_in_Organizations.pdf
5. https://filene.org/assets/pdf-reports/1752-94Predicting_EE_Turnover.pdf
6. Csikszentmihalyi’s flow model – https://www.toolshero.com/effectiveness/flow-model-csikszentmihalyi/
7. https://classeval.wordpress.com/introduction/basic-evaluation-measures/
8. https://en.wikipedia.org/wiki/The_Five_Dysfunctions_of_a_Team