Learn and track your progress as a guitar enthusiast

Opportunity:


Fender Musical Instruments Corporation is a manufacturer of guitars, basses, amplifiers and auxiliary equipment. They target all levels of players from beginners to experts, across musical genres. The opportunity has arisen from their struggles in retaining their customers since many initial learners drop out due to the difficulty of subject and no clear direction of learning. They realized that a person who goes past the first year of training buys equipment worth thousands of dollars over their lifetime (Business Insider). Thus, the opportunity is to use digital tools and augmented intelligence to retain customers.


Solution:

Fender utilized sensors on their devices, big data analytics and cloud computing to launch Fender Play, a digital service that could generate revenue. The basic advantages to their solution can be broken down into several points:

  • Track users’ progress, and give them access to systematic modules across a variety of ‘paths’ so that they can learn according to their own style. This solution is also driven by a demographic shift where the majority of novice guitar players are trying to learn songs that they like, not necessarily learn techniques emphasized in traditional classes or play in a band.
  • In addition to providing users the ability to skip certain lessons, allow them to go at their own pace to save time and money compared to traditional instructors.
  •  Inter-device connectivity (guitars, amps, phone), with automatic updates and reminders, causing higher brand loyalty due to Fender owning the entire stack of guitar-related services.


Commercial promise:

Promise #1: Introducing a digital interface between a player and a guitar by adding sensors is a key enabler of the solution. Other musical instruments have interfaces that are easier to digitize (electric pianos). Digital pianos created a niche and made self-learning easier. We can expect a similar effect with digital guitars. An integration with social media and smartphones creates a collaboration platform that may, for example, allow remote band recitals, further reducing quitting rates.


Promise #2: Introduction of the smart guitar may do to a traditional guitar what electric piano did to an “acoustic” piano: displace it. Fender can benefit from a first mover advantage if the guitar market shifts towards digital.


Promise #3: Fender has considered the instructors segment by creating a tool that allows them to monitor and follow-up with students post-lesson during at-home practice.  By doing so, they are showing that the platform was built to be accepted by all customers in the market without exclusion or resistance.

Because of the lack of publicly available data, we have found it difficult to directly measure the effectiveness of the program. Thus, we cannot predict the potential revenue and growth from this segment.

Competition


Fender has traditionally competed with large instrument and especially guitar manufacturers. Gibson is the most prominent competitor in this space. Fender could change their business model and reposition themselves as a digital services company, they would find themselves going against competitors in the digital content industry (e.g popular channels on Youtube) or even community and collaboration-based music platforms such as Soundcloud or Bandcamp if it allows users to post their own music on FenderPlay. These competitors might be equipped with much better analytic tools and capabilities, but there might be certain niche markets where Fender has better brand loyalty and can attract people (guitar-heavy music like rock).


Proposed alteration   


Fender Play is priced at $19.99 a month for beginners. While this subscription price might seem reasonable, offering a free trial for customers who have purchased a Fender guitar would attract them to subscribe by trying it out before spending their money.

Fender should look into exploring the data collected and observe which lessons have users actually found helpful based on their level. By looking back at the data and observing which patterns were most likely for their users to stay as a loyal customer, Fender should then create clusters based on the data collected of each segment and create suggestions that were most likely to be helpful based on historical data and correlations. This strategy should start with casual users who typically dropped guitar lessons as part of their frustration because it narrows the suite of offerings while the digital ecosystem is built. With this increased intelligence and cloud storage capabilities, they might then be able to provide more personalized offerings in their ‘paths’.

A different strategy would be to link to popular music-tech companies like Spotify or Soundcloud to approach the target market that learns guitar to create their own music or collaborate with other artists.

Lastly, in order to keep their customers engaged so that they do not give up, Fender might incorporate a competition element into the platform, in which users would be able to see a scoreboard with their rankings against other peers. If there are rewards, badges, levels and an ability to compare progress with peers, people may have an increased incentive to stay involved than otherwise.


Sources:


https://blogs.wsj.com/cio/2017/07/25/the-morning-download-fender-launches-internet-of-the-guitar/


https://blogs.wsj.com/cio/2017/07/24/fender-amps-up-its-digital-play/


https://www.reuters.com/article/us-fender-musical-software/electric-guitar-maker-fender-jumps-into-online-learning-idUSKBN19R145


http://www.businessinsider.com/fender-play-review-2017-10


Team Members:

Mohammed Alrabiah

Tuneer De

Mikhail Uvarov

Colin Ambler

Lindsay Hanson

Optimizing your Garbage Truck with Big Data

Opportunity


The multi-billion dollar residential waste management “industry” (both public and private entities) presents a substantial opportunity for innovation through the application of data-based solutions to collect waste more efficiently and improve utilization of waste collection resources.  Significant, yet variable, resource inputs (trucks, labor, and fuel being most directly relevant) offer direct cost savings for municipalities or commercial entities able to gain efficiency in applying those resources.


This segment is ripe for innovation for several reasons.  Globally, urbanization continues to be a trend, with increasing populations living in ever closer proximity.  The composition of waste continues to change between recyclables, compostable waste, and landfill waste. As such, resources for the collection, sorting, and disposal of solid waste continue to move towards increased categorization.  Lastly, the waste management industry appears to be receptive to disruptive efforts, as evidenced by cities such as New York that are undertaking significant waste reduction measures.


Furthermore, solid waste management is a sector that has largely avoided any significant optimization efforts.  For example, in 2013 the city of Chicago instituted a simple “grid system” for the deployment of its collection trucks and abandoned its previous “ward-based” system.  As a result of this relatively simple change, Chicago was able to deploy 40 fewer trucks per day (320 vice 360) and gained an $18M annual cost savings against a 2013 budget of $166M for the Bureau of Sanitation – an 11% reduction.  As impactful as that reduction was, it was the result of an unsophisticated and non-data driven solution which did not (and does not) take advantage of numerous technological tools for further optimization.


Solution


Utilize existing data available from GPS and scale sensors on-board collection trucks to collect, analyze, and employ information regarding individual or street level solid waste production to more efficiently employ waste collection resources (trucks, labor, fuel, time, etc).  Armed with an informed picture of the specific house, street, or neighborhood-level of solid waste production, which would become more informed over time with ongoing data collection, the public or private solid waste collection entity could then optimize its resource acquisition, retention, maintenance, and utilization.  Each entity could optimize for route length, “truck-sized” routes (in pounds of waste), a specific shift length, distance traveled, cost, or other desirable optimums.


Data Collection


Modern collection trucks are currently equipped with on-board scales, GPS systems, and vehicle monitoring systems.  The on-board scale is used primarily to help drivers comply with weight restrictions (e.g. small bridges and weight restricted roads) and avoid exceeding the vehicle weight rating.  GPS data includes time and location and, in turn, speed and number stops. The on-board vehicle monitoring system provides fuel usage data, engine RPMs, and speed. Data from each of these sensors and systems could be downloaded from each truck periodically for analysis and incorporation.  Any trucks lacking these features can be readily upgraded at a low cost. This data, merged in the appropriate way, could produce a data set which readily lends itself to powerful resource optimization algorithms.


Exhibit 1: A theoretical example of one truck’s weight over a work day.  Increases in weight allow one to deduce the amount of waste collected at each stop.  Merging this data with time-stamped GPS and operational truck data would allow one to deduce the amount of garbage collected at the block, street, or even individual building level (contingent on scale accuracy).


Pilot Program


The pilot program would be rolled out in a city with a large concentration of residential neighborhoods that would benefit from increased efficiencies in waste management. The program would begin by ensuring the existing fleet is equipped with the requisite on-board systems to collect data about the quantity of trash picked up at each stop along an existing route, whether at the house, street, or neighborhood-level. During this time, additional data would be collected about the costs of fuel, labor and other operating expenses associated with their route. Over the course of several months, the quantity of trash picked up at individual stops, marked on the GPS system, would be aggregated in a central location. After a sufficient data set is collected, the optimization algorithm would be applied to develop a new route or routes optimized for time, pounds of trash, fuel efficiency, distance traveled, costs, or whichever parameters the municipality or commercial entity seeks to optimize.  The benefits associated with the optimized routes could then be compared against the original routes to determine the efficacy of the program.


Commercial Viability


Currently, the global waste management industry is valued at $240B in 2016 and is expected to grow to roughly $340B by 2024. With this growth will come a dramatic increase in fuel consumption, labor costs and other operating expenses associated with garbage truck fleets. The opportunity to apply data-based solutions for the optimization of routes, fleet utilization, and labor force would potentially provide billions in annual savings for both waste management companies and consumers.


Sources


Chicago Department of Streets and Sanitation

https://www.cityofchicago.org/city/en/depts/streets.html


The City of New York Department of Sanitation

http://www1.nyc.gov/assets/dsny/site/home


Solid Waste Management Market Share & Forecast, 2017-2024

https://www.gminsights.com/industry-analysis/solid-waste-management-market


Trends in On-board Scale Systems for the Waste Industry

https://wasteadvantagemag.com/trends-in-on-board-scale-systems-for-the-waste-industry/


Real-World Activity and Fuel Use of Diesel and CNG Refuse Trucks

http://www.cert.ucr.edu/events/pems2014/liveagenda/25sandhu.pdf


Average Fuel Economy of Major Vehicle Categories

https://www.afdc.energy.gov/data/10310


The Economics of Electric Garbage Trucks are Awesome

https://qz.com/749622/the-economics-of-electric-garbage-trucks-are-awesome/


Smart traffic signals

Problem

Previous road management systems ran independent of traffic and car information. This results in many inconveniences:

  • Lost productivity and wasted time: Everyday traffic congestion promotes loss of productivity for companies. In many countries, employees spend an excessive amount of time in traffic when they could be working on their jobs.
  • High number of traffic accidents: Inefficient use of traffic lights increases the risk of car accidents.
  • High number of pedestrian accidents: a study suggests that walking in traffic situations is 10 times more dangerous than travelling as a passenger by car. Moreover, this study also suggests that 15% of total people killed in European roads are pedestrians.
  • High environmental cost and increased energy spent waiting in traffic: The stop-start driving and long time waiting in traffic is inefficient and very polluting to cities.  

Addressing these inconveniences by using a computer vision application (real time smart traffic lights) helps drivers, pedestrians, municipalities and even businesses (gains in productive time).

Solution

The solution proposed encompasses two main elements:

  • Two cameras located on one post of a traffic light: one oriented to capture pedestrians, and the other to capture car traffic
  • A machine learning algorithm that is capable of:
    • Recognizing “new elements” in every frame, the camera captures – be it pedestrians or cars
    • Predicting (i) the trajectory of these elements using AI, (ii) the intensity of future traffic
    • Making real-time decisions on the “position” of traffic lights for both cars (green, yellow, red) and pedestrians (white, red).

Effectiveness and commercial promise

For pedestrians, previous applications either didn’t take input from pedestrian traffic or used a manual push-button for input. The proposed solution is definitely much more attractive to pedestrians: it does not require any additional action from their end and still manages to improve their outcomes.

For car traffic, previous smart traffic systems used a system called an inductive loop detector, that is embedded under the street. The benefit of the new solution compared to this lies in the following:

  • Recent studies have shown loop inaccuracies of up to 20%, when compared with actual footage. This lack of reliability, especially in extreme congestion where these solutions are most needed, hinders extreme optimization of traffic
  • Detection of faulty loops is very difficult, and maintaining them often requires blocking roads, which goes against the objective of easing traffic

In terms of outcomes, the prototypes for this technology have started being tested and have shown promising results especially in smooth light-change conditions and when few objects are present.

Anticipated competition

Companies that have access to big sources of data have an advantage to provide solutions using machine learning. Among those companies we could give the example of Google and Microsoft that are trying to revolutionize some industries by developing advanced analytics for their customers. In terms of traffic management solution these companies could create partnerships with the government and municipalities to develop integral solutions to enhance the traffic management. Currently they have showed some efforts in the field:

Google: The company is already involved in the traffic management field with his applications Google Maps and Waze. Those could help them have a important source of information to continue developing solutions. Recently they have backed up a venture, through google ventures, called Urban engines that is working in aggregating traffic data to create predictive models that will give users the ability to improve routes management and avoid congestion based on what time of day it is and what’s happening in the area.

Microsoft: Microsoft has azure, his cloud analytics tool. With it they are helping companies develop specific tools to improve their businesses through analytics. In terms of traffic management they are involved in developing sustainable cities through CityNext, an initiative that they are sharing with various companies, such as Cubic, to solve transportation issues.

Alterations proposals

Apart from the current, and above mentioned, applications that computer vision is being used for in traffic lights, we propose the following different uses from which society can benefit from:

  • Response to emergency cars (e.g. ambulances, fire trucks). Many more lives could be saved if ambulances and fire trucks arrived on time at the emergency point by having traffic lights change in their favor.
  • In many countries, specially high-crime countries in Mexico and LatAm, many robberies and kidnaps occur during red lights. Some countries have allowed drivers to run pass a red light after midnight for security reasons. However, this increases car accidents. Therefore, crime prevention is another great use for this technology.
  • With the use of the cameras and machine learning algorithm, it will be possible possible to have a more accurate speed management in which the speeding car can be recognized through the cameras.

Sources:

Usefulness of image processing in urban traffic control, Boillot (https://ac.els-cdn.com/S1474667017438730/1-s2.0-S1474667017438730-main.pdf?_tid=efc0cf01-ae0b-4c44-831c-4295172c54b0&acdnat=1522637076_32242720358f549ac1c0a6a27df47e31)

Computer vision application: Real time smart traffic light (https://pdfs.semanticscholar.org/d1c3/bfc4e8ff2861137da2af817e4fbe709339da.pdf)

Traffic management startup backed by google: Urban engines

(https://www.roadsbridges.com/traffic-management-google-backed-startup-vies-predict-congestion-patterns)

A New Smart Technology will Help Cities Drastically Reduce their Traffic Congestion

(https://www.pastemagazine.com/articles/2017/04/a-new-smart-technology-will-help-cities-drasticall.html)

Microsoft CityNext

(https://enterprise.microsoft.com/en-us/industries/citynext/sustainable-cities/transport/)


Team:

Francisco Galvez

Stephanie Saade

Marisol Perez-Chow

Luca Ferrara

Caitlyn Grudzinski

Wing Kiu Szeto

Physimax profile by Augmented Einstein

Opportunity:

Physimax is an Israeli sports technology company dedicated to helping athletes prevent and recover from movement-based injuries with the goal of minimizing dollars lost to injury and preventing career ending injuries for athletes. Physimax helps competitive sports teams minimize players’ injury risk and maximize athletic performance by providing critical and objective data about an athlete’s musculoskeletal mobility, strength, stability and technique through an automated, real-time, visual-analysis test.

Solution:

The technology combines scientific studies, sports medicine protocols, computer vision algorithms and machine learning abilities to provide clear actionable insights for athletes and teams of all levels with the click of a button. The platform uses computer vision and machine learning technology to analyze athletic movement, identifying nuances in movement patterns. It provides tracking, alerts, and recommendations for individualized training programs to minimize injury risk, maximize performance and help injured athletes recover quickly.

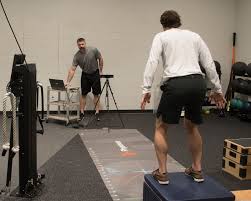
Physimax assessments take only 8 minutes and can be administered by anyone; it doesn’t require expertise or prior knowledge. It is administered with a computer and Xbox kinect camera, making it highly portable. The short assessment time makes it possible to assess hundreds of people in hours. The program includes a wide range of automated functional movement tests, and is suitable for many different types of athletes.

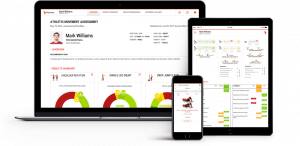
Athlete assessment scores are calculated in relation to same-level norms, maximizing the accuracy level of the results. This allows athletes to change their programming to address deficiencies in their performance and lower the chance of injury.

Effectiveness, Commercial Promise, and Competition:

Effectiveness is hard to measure, as it is impossible to test an individual using the technology against a version of himself who has not used the tech. However, the assessment has successfully pointed out deficiencies in athletes’ movements, and athletes have changed their exercise programming to bring their injury risk scores down to the norm.

  • The Indiana Pacers have employed the app and now have the lowest salary dollars lost due to injury [1]
  • One notable use case was when Physimax was used to identify factors in a Pacers player’s hip movement that were affecting his knee.  After pinpointing the problem, the player received a particular pelvic adjustment that considerably lowered his risk factor of knee injury.

Partnerships with major athletic schools and professional sports teams provide huge potential for commercial growth. Physimax has been validated by several academic institutions including The University of North Carolina, The University of Connecticut and the Military Academy at West Point.

Professional sports teams, however, provide the most lucrative opportunity as they stand to gain the most benefit. For example, NBA teams have lost a collective total exceeding $328 million salary dollars to injury and illness [1] and the MLB lost $1.2 billions on players on the disabled list in 2016 [2].

Sports biometrics is a nascent and highly fragmented space. Physimax faces competition from companies like Kinexon and Kistler, both of which provide real-time data on athletic performance to aid in injury prevention.  Kinexon in particular has a competitive advantage, as its wearable sensor allows a continuous collection of data in different scenarios. Presently, Physimax’s assessment is limited to isolated training sessions. l rehabilitation center.

Suggestions / Improvements:

To better position Physimax for commercial success, the company should consider implementing the following:

  • Expand the number of potential injury risk factors the app is capable of evaluating, as it gathers more data and use cases over time. This would generate more accurate injury predictions with fewer false negatives.
  • Subtract computer and accessory camera to run the application. The product should be moved onto smartphones for easier assessment and more widespread commercial adoption. This would also help individual athletes to monitor their own recovery.  
  • Increase level of detail for assessments and smart suggestions on exercises to address athlete deficiency. For example, the app could tell the subject which muscle is potentially affected in addition to recommending exercises.  
  • Add sensor for all game-time and workouts to provide even more information on players

Sources:

[1] http://instreetclothes.com/2018/02/22/nba-injury-report-star-break-2017-18-season/

[2] http://www.businessinsider.com/mlb-injured-players-2017-7

https://www.sporttechie.com/physimax-provides-real-time-musculoskeletal-athlete-testing-to-try-and-avoid-injuries/

https://finance.yahoo.com/news/indiana-pacers-deepen-scientific-foundation-190000943.html?_fsig=IxL2twOGqNQ7wzUPKvuNmw–

Team Members:

Pavlina Plasilova, Kelly de Klerk, Yuxiao Zhang, Aziz Munir, Megan McDonald


Physimax assessment, with laptop and camera.

Physimax dashboard.

Stuck with 2Ys –“Latch” – Final


  • Opportunity

According to Pew Research poll, 40% of Americans use online dating(1) and 59% “think online dating can be a good way to meet people”(2). UK country manager of a dating app, eHarmony, Romain Bertrand mentioned that by 2040, 70% of couples will meet online(3). Thus, the online dating scene is a huge and ever growing market. Nevertheless, as of 2015, 50% of the US population consisted of single adults, only 20% of current committed relationships have started online, and only 5% when it comes to marriages(1). There is a clear opportunity to improve the success rate of dating apps and improve the dating scene in the US (for a start). As per Eli Finkel from Northwestern University (2012) (3), likelihood of a successful long-term relationship depends on the following three components: individual characteristics (such as hobbies, tastes, interests etc.), quality of interaction during first encounters, and finally, all other surrounding circumstances (such as ethnicity, social status etc.). As we cannot affect the latter, dating apps have been historically focusing on the first, and have recently started working with the second factor, by suggesting perfect location for the first date etc. For individual characteristics, majority of dating apps and websites focus on user-generated information (through behavioral surveys) as well as user’s social network information (likes, interests etc.) in order to provide dating matches.  Some websites, such as Tinder, eHarmony and OkCupid go as far as to analyze people’s behavior, based on their performance on the website and try to match the users to people with similar or matching behavior.

Nevertheless, current dating algorithms do not take into account vital pieces of information that are captured neither by our behavior on social media, nor by our survey answers.

  • Solution


Our solution is an application called “Latch” that would add the data collected through wearable technology (activity trackers such as Fitbit), online/offline calendars, Netflix/HBO watching history (and goodreads reviews), and user’s shopping patterns via bank accounts to the data currently used in apps (user-generated and social media) in order to significantly improve offered matches. According to John M. Grohol, Psy.D. from PsychCentral, the following are the six individual characteristics that play a key role in compatibility of people for a smooth long-term relationship (4):

    • Timeliness & Punctuality (observable via calendars)
    • Cleanliness & Orderliness (partially observable – e-mails/calendars)
    • Money & Spending (observable via bank accounts)
    • Sex & Intimacy
    • Life Priorities & Tempo (observable via calendars and wearables)
    • Spirituality & Religion (partially observable via calendar, social media, Netflix/HBO patterns, and e-mail)

Out of the six factors mentioned above, 5 are fully or partially observable and analyzable through the data already available online or offline via the sensors mentioned earlier. As all the information we would request digs deeper into privacy circle of a target user, we would be careful to request only information that adds value to our matching algorithm and will use third-parties to analyze such sensitive info as spending patterns.


  • Commercial Viability – Data Collection

The dating market size has reached $2.5 billion in 2016(6), there are over 124 million accounts registered on online platforms.As a new company entering the market Latch would have a clear advantage over the current incumbents, as it would not have to use old and commonly used interface of dating process. As per Mike Maxim, Chief Technology Officer at OkCupid, “The users have an expectation of how the site is going to work, so you can’t make big changes all the time.”Prior to the launch, we would have to collect initial information. In order to analyze only the relevant data we would have to analyze the behavioral patterns of current couples before they started dating. Thus, we would aggregate data available on their historical purchase decisions and time allocation in order to launch a pilot.

  • Pilot

The pilot version will be launched for early adopters based on human- and machine-analyzed historical data of existing couples. Step 1 – Collecting Initial DataOur initial observation pool will be University of Chicago and peer institution students. We chose this group of people, as in order to compile the initial data on compatibility we would need to have a trust of people providing us with their private information, such as email accounts. We will start by approaching existing couples across the universities, focusing on couples that were formed recently. In order to attract as many students as possible, we will offer university-wide benefits, such as cafeteria coupons, book discounts etc. As a result, we will collect historical information (before the start of a relationship) on social media, e-mail, calendar, fitbit and other activity from tools mentioned earlier, by gaining access to respective accounts etc. Step 2 – Analyzing the data

We will combine all the collected data and observe for recognizable and significant patterns. For example, how much being early birds or night owls have hustatistically significant effect on the likelihood of them matching their partners etc. Using machine learning we will analyze the data until we find all the significant variables that contributed to the likelihood of our existing couples matching. We will be focusing on the following observable characteristics in each tool used:


Tool Characteristics
Calendar Accounts
  • Actively fill in Google Calendar, iCal, or other calendar at least during last 6 months
E-mail Accounts
  • Topics discussed
  • People contacted
  • Overall organization of e-mails (how organized are incoming e-mails, how many days on average e-mails are unread etc.)
Social Media
  • Topics discussed
  • Things liked
  • People contacted
  • Locations visited
Entertainment Accounts
  • Movies, Books, Songs watched/read/listened/liked (ranked)
Fitbit
  • Sleeping patterns
  • Preferences in sports
  • Activity Level
  • Nutritious preferences
  • Physical parameters
Bank Accounts
  • Purchases by categories, amounts, time of the year, season, brands


Step 3 – Attracting Early Adopters / Market adoption

Based on the compatibility variables derived from the initial observation pool analysis, we will attract early adopters. In order to attract early adopters we will position ourselves as the new dating app that uses a much broader set of data in order understand the user and find him/her the perfect match.

Create awareness:

In order to attract early adopters we plan to promote the app during events that attract large numbers of people, such as musical concerts, sport events and various fairs.  We would also offer promos around important holidays, such as Valentine’s day or New Year Eve.

From Awareness to Download to Use:

U.S. Millennials have 3-4 dating apps installed on their phones on average  due to the low quality of matches, all of them require attention (e.g. swipes, coffee beans etc.) and can be quite frustrating, hence we will promote usage by directly addressing the low return-on swipe utility.

In order to lower the churn rate that is very high for any given app (50% per year)(7), we would make the initial registration very easy: no long surveys to be filled out, only linking your social media account (facebook). Once the user starts using we will show improvement opportunities for higher quality matches by adding additional sources of data such as e-mail accounts, calendar accounts, other social media accounts (incl. professional), entertainment accounts (Netflix, Audible, Amazon Prime etc.). Once the user starts using the app we will offer more time consuming opportunities such as answering survey questions developed by behavioral psychologists.

Step 5 – Growth

Second Phase Expansion 1. Future expansion opportunities exist in increasing the number of information sources once the user base is large enough. On top of existing data sources (e-mail accounts etc.) we will expand into integrating DNA ancestry information (such as provided by MyHeritage DNA) as well as medical history information.

Second Phase Expansion 2.

Using the collected user preference data we will expand into offering perfect first date setups, such as movies that would be liked by both users. This will create monetization opportunities for referencing users to events and restaurants.

  • Team:

Alexander Aksakov

Roman Cherepakha

Nargiz Sadigzade

Yegor Samusenko

Manuk Shirinyan

  • Sources:
  1. http://www.eharmony.com/online-dating-statistics/
  2. http://www.pewresearch.org/fact-tank/2016/02/29/5-facts-about-online-dating/
  3. http://www.telegraph.co.uk/technology/news/12020394/DNA-matching-and-virtual-reality-The-world-of-online-dating-in-2040.html
  4. https://www.washingtonpost.com/news/the-intersect/wp/2015/11/11/the-one-thing-about-matching-algorithms-that-dating-sites-dont-want-you-to-know/?utm_term=.20846eb81ca8
  5. https://psychcentral.com/blog/archives/2014/10/08/6-absolute-must-haves-for-relationship-compatibility/
  6. http://blog.marketresearch.com/dating-services-industry-in-2016-and-beyond

Smart Store: Track your store like you would track the vitals of a patient in surgery

You think the shopper is smart?

With the rise in consumer preferences towards natural, organic and non-GMO food, retailers are faced with the challenge of supplying fruits, vegetables, and protein with a shorter shelf life, and adjusting to these trends of a dynamic marketplace. 86% of shoppers are confident the food they buy is safe from germs and toxins, down from 91% in 2014. Retailers must become more operationally efficient or increase their stock to overcompensate for higher rates of spoilage in order to counteract shorter shelf life challenges. Planning for fresh produce is more complicated than for non-perishable goods. According to a BlueYonder study, 68% of shoppers feel disappointed with the freshness of their purchases, and 14% of shoppers seek organic certification.

By using machine learning solutions, retailers will be able to optimize the environmental conditions affecting spoilage. In addition, there are risks of being out of compliance on food, health and environmental safety regulations with very high penalty, like Walmart paid $81M in environmental compliance.

How can you keep up?

Grocery retailers generally have low profit margins, so slight improvements to efficiency are important. Our machine learning solution is aimed at helping retailers improve their management of shorter shelf life products, and ultimately their profitability through optimization of their energy cost and prediction of temperature control equipment failure.

  • Energy Savings: In some cases, utilities can amount to up to 50% of profit margin for a store, and energy savings driven by machine learning translate immediately to profit margins. For example, within the perishable seafood or meat sections, overcooling is a significant cost that can automatically be optimized by sensors that measure temperature in a cooler or refrigerator.
  • Effectivity and Efficiency: Better allocation of resources like people and machines is very useful for top and bottom line. E.g. out of stock inventory can lead to $24M lost sales per $1B retail sales. Automatic tracking of inventory levels can help increase productivity and also revenues.
  • Predictive Maintenance: Because refrigeration equipment has to run 24 / 7, there are high breakdown rates of equipment. Sensing equipment can be applied to HVAC and Nitrogen equipment to predict failure ahead of time. Even just small freeze / thaw cycles can quickly damage product and lead to waste for retailers.
  • Compliance: FSMA and EPA includes multiple guidelines for retailers and grocery stores to follow, with high penalties for out of compliance.
  • Consumer behavior: Consumer preferences and potential trends can be identified and acted upon if predicted. The Amazon store could even track which products you are interested in, but had not purchased.
  • Risk mitigation: We could observe financial transactions, customer behavior etc. to predict risks, fraud, shoplifting etc. automatically and proactively.

Organizations are already moving to smarter technology for help.

What if the store was also smart?

Grocery retailers could use advanced analytics through IOT and other technology to revamp the way they monitor their stores.

  1. Video feeds
  2. Point Of Sale sensors
  3. Mobile phones / equipment of Associates in store
  4. IR Motion Sensors
  5. HVAC and Energy monitoring using sensing of temperature, pressure, humidity, Carbon Monoxide
  6. Weight Mats
  7. Parking Space sensor
  8. Digital Signage
  9. Gesture Recognition/ accelerometers
  10. Door Hinge Sensor motion/ pressure
  11. Wifi Router and connections
  12. Shelf Weight
  13. Air Filter/humidity
  14. Lighting
  15. Electricity, Water, gas meters
  16. Spark (Temperature) for places this device is taken to

Pilot

We would perform A/B testing to measure sensor performance and outcome in the controlled environment. The specific experiment is for milk preservation and storage. We would like to measure energy saving, ensure compliance to FSMA and EPA and predict refrigerator breakdown and maintenance.

    • Refrigeration is the single most important factor in maintaining the safety of milk. By law, Grade A milk must be maintained at a temperature of 45 °F or below. Bacteria in milk will grow minimally below 45 °F. However, temperatures well below 40 °F are necessary to protect the milk’s quality. It is critical that these temperatures be maintained through warehousing, distribution, delivery and storage.
    • The cooler refrigerated milk is kept, the longer it lasts and the safer it is. As the product is allowed to warm, the bacteria grow more rapidly. Properly refrigerated, milk can withstand about two weeks’ storage.
    • Pilot program: For the cost of $15 per fridge/freezer we can monitor food’s temperature and receive audible and visual alarm when temperatures exceed its minimum or maximum temperature range. For $39 we could measure temperature, humidity as well as when the door is open and closed.

We would partner with two to three smaller to medium size organic grocery stores (Trader Joes) with the high traffic, ex: city to test the impact over two to three weeks period.

Compliance info for meat preservation and storage is provided below:

Example use cases:

  1. Predictive Device Maintenance to avoid compliance lapse (e.g. Fridge for Food Safety, Fire Safety equipment, lighting, etc.)
  2. Hazard detection and prevention through monitoring of toxic substance spill and disposal (air filter, shelf weight and video sensor)
  3. FSMA compliance across labels, food expiry, storage conditions, etc.
  4. Health safety with store conditions like canopy use, weather, leaks etc.
  5. Temperature, defrost and humidity monitoring for Ice-cream, meat, dairy, and pharmaceuticals
  6. Video analysis to predict long lines and avoid bad customer experience or lack of lost customers increased productivity etc. by alerting and optimizing resource allocation
  7. Video + Point Of Sale analysis for fraudulent transactions avoidance

A central monitoring within stores, and centrally can be created, to mimic the Nasa base in Houston, is always able to support all adventurers within the store. Roger that?


Sources

FMI U.S. Shopper Trends, 2016. Safe: A32. Fit health: A12. Sustain health: A9, A12. Community: A12, * The Hartman Group. Transparency, 2015.

http://www.cnsnews.com/news/article/wal-mart-pay-81-million-settlement-what-epa-calls-environmental-crimes

https://www.fda.gov/food/guidanceregulation/fsma/

https://www.epa.gov/hwgenerators/hazardous-waste-management-and-retail-sector

Amazon store  https://www.youtube.com/watch?v=NrmMk1Myrxc

https://foodsafetytech.com/tag/documentation/

http://www.securitygem.com/cao-gadgets-inexpensive-and-tiny-sensors-for-your-smart-home/

http://www.clemson.edu/extension/hgic/food/food_safety/handling/hgic3510.html


Team – March & the Machines

Ewelina Thompson, Akkaravuth Kopsombut, Andrew Kerosky, Ashwin Avasarala, Dhruv Chadha, Keenan Johnston

Team Dheeraj – Check Yourself ($225K)

By: Trevor Gringas, Prashob Menon, Dheeraj Ravi, Joanna Si, DJ Thompson

Opportunity:

Fake news is “a made up story with an intention to deceive”. It originated in the BCs when Julius Caesar’s son-in-law, spread false rumors about Marc Antony, culminating in Marc Antony being declared a traitor in the Roman senate. So fake news is not a new phenomenon. However, in the last year, the engagement of users across fake news websites and content has increased significantly across all mediums and types (headlines, sources, content). In fact, in the final 3 months of the 2016 election season, the top 20 fake news articles had more interactions (shares, reactions, comments) than the top 20 real articles.1 Furthermore, 62% of Americans get their news via social media, while 44% use Facebook, the top distributor of fake news.2 This represents a major shift in the way individuals receive information. People are led to believe misleading and often completely inaccurate claims. Decisions that are made off of this information are more likely to be incorrect, leading to a serious threat to our democracy and integrity.

Media corporations are recovering from playing a part in either disseminating this news or inadvertently standing by. Governments have ordered certain social media sites to remove fake news or else face a hefty punishment (e.g. €50 million in Germany).3 Companies such as Google and Facebook are scrambling to find a solution and are investing millions in internal ideas and external partnerships. However, it is extremely difficult to come to consensus on what defines fake news. Often times, ideological underpinnings define one’s proclivity to call something fake or not. This is why our solution focuses on identifying:

  • claims which are 100% false (e.g., “there are millions of illegal voters in the US”),
  • scientific studies which have been disreputed (e.g., “power poses reduce cortisol levels and increase confidence”), and
  • conspiracy theories (e.g., “the moon landing was staged”).

Satire and opinion pieces such as  articles from The Onion or a statement like “Russians undermined the US political process” are currently out of scope given that Artificial Intelligence (“AI”) is still far from being able to semantically understand words like a human. Human beings cannot even agree on such things; thus, it is unreasonable to expect AI to be able to do so in the near future.


Solution:

Check Yourself (“CY”) provides real-time fact checking solutions to minimize the acceptance of fake news. It combines natural language processing techniques with machine learning techniques to immediately flag fake content.

CY’s first approach will employ semantic analysis. Often times, fake news articles are purely clickbait and meant to induce someone to click on an article to generate ad revenue. These articles will have gibberish or unrelated content from the headlines. Our solution will first examine whether the headline and the body of an article are related/unrelated and then whether the content supports the headline. Furthermore, the CY solution leverages fact-checking websites or services to determine whether the actual content itself has anything explicitly fake. Verification would happen against established websites, academics, and other website attributes (e.g. domain name, Alexa web rank).

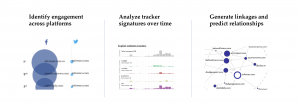
The second approach involves (i) identifying platform engagement (Facebook, Twitter), (ii) analyzing website tracker usage (ads, cookies, widgets) and patterns over time, and (iii) generating links between those items to predict relationships. In the past year, the proliferation of ad trackers has led to many domains being created for clickbait and then quickly being abandoned to avoid detection. Furthermore, these websites often link to common platforms and other websites where one can find patterns in fake news sources that are distinct from those created by established news sites. This will result in a neural network through which the CY algorithm may predict the probability that the source is fake.

Combining the above two approaches leads to a novel solution as it semantically analyzes the text and assesses the veracity of the source to generate a probability score for how fake an article is.

The first phase of this will be designed in-house by a data scientist. After devising a baseline result and target, we will then use crowdsourcing to improve upon the algorithm. Given our limited in-house resources and the novel nature of this problem, we want to maximize our potential for success by generating ideas from individuals from all disciplines and encouraging collaboration either through an in-house crowdsourcing platform, or through existing platforms such as InnoCentive. We also intend to build out a mobile application through which users may curate and select news subscriptions that would automatically be scored using the CY solution. The mobile app will allow users to submit feedback on the accuracy of CY’s probability scores.

The next stage in the company’s roadmap is to continuously improve on the product and incorporate other features beyond a mere probability score and in-article highlights. These could include a list of corroborating sources or a list of “real”/factual news articles on the same subject. In the long-term, the goal is to be able to apply the algorithm not only to written text articles, but to be able to convert verbal speech into text, subsequently run the algorithm, and have CY call out inaccuracies on an almost real-time basis. This long-term solution would take into account not just textual relationships but other things such as verbal intonations and facial muscle movements so that factors such as mood and facial expressions can help determine the likelihood of fake news. CY intends to be a real-time lie detector for all types of news mediums, print, video, and yes – even live in-person interviews. Impossible you say? Tell that to the folks at Google Brain who created the computing power to essentially perform real-time language translation. The computing power available today is rapidly increasing such that aspirations of this sort are indeed achievable.

Implementation/Pilot:

Pilot 1 will be run with articles on the 2016 election. Subject matter experts will be asked to evaluate our algorithm in real-time. We will place the experts in four conditions – liberal, conservative, independent, no affiliation – and run two experiments.

Experiment 1.  Assessing speed and accuracy of the CY algorithm on fake news sources. We will present the exact same news stories to each group. The algorithm, along with the experts, will evaluate the article and both the speed of the human experts’ comments and their assessments will be compared against those of the CY algorithm. Both fake news sources and legitimate sources will be tested.

Experiment 2.  The second phrase will involve snippets of phrases in the various articles (not opinionated statements, but facts or lies).

Pilot 2 will be conducted with an academic journal or newspaper. In line with our propensity for crowdsourcing and desire to collaborate across disciplines, our team will test the algorithms against a team of faculty and students fact-checking sources for publication.

The Competition:

Many companies are trying to solve this problem. As noted above, Facebook and Google are key developers in this space. Existing solutions largely consist of human fact checkers, but they are not as comprehensive in their approach as we are. Furthermore, human fact checkers are rarely able to provide feedback in real-time. Universities are also trying to solve this problem, and are doing so with small teams of students and faculties. The advantage CY has over universities as well as the tech giants is two-fold. First, we intend to create neural networks that span various news sites and search engines (Google, for e.g., currently relies only on its search algorithms and platforms)[1] Second, our focus on crowdsourcing the solution and crowdsourcing for further feedback allows for the best ideas in a newly emerging area.

Market Viability:

Even though our value proposition affects companies and customers, we will primarily start with a B2B product. We anticipate collaborating with a news aggregator as an initial keystone customer. Given the strength and connections of our Advisory Board, CY is confident that initial keystone customers will not be an issue. As more media and news aggregators adopt a fake news notifier, content producers themselves will be incentivized to use such a service as well. Large media companies have around 10-20 fact checkers on staff for any live debate. The media company cost for fact checkers alone results in about $600K-$1.2M (assuming they spend $60k per checker per year). Furthermore, these customers often use Twitter and Reddit and would find our service invaluable to confirm the veracity of statements/claims immediately. Even more staff is on hand for research publications and institutions to verify academic journals and articles prior to publication. We anticipate that CY would reduce at least 50% of the fact checking resources of a media company. Key to CY’s continued success is to gain quick adoption and serve as the go-to platform for real-time fact-checking solutions so that additional features (such as a suggested sources feature described above or a social sharing aspect) have distinct and sustainable value. The product will be offered as a subscription service for lower-usage customers, and then as a combination of a subscription + usage cost basis for larger customers.

Conclusion:

At this time, we are asking for $225K to cover development costs and expenses over the next year. The bulk of this funding would go towards hiring a data scientist with the remainder covering administrative cost including IT and Server costs. To supplement this, we are also working on securing grants from agencies who are keen to address the problem of fake news.


[1] For a selection of articles on the efficacy of crowdsourcing and its potential, please see: King, Andrew and Karim Lakhani. “Using Open Innovation to Identify the Best Ideas.” Sloan Management Review 55(1):SMR 466.

Boudeau, Kevin J. and Karim R. Lakhani. “Using the Crowd as an Innovation Partner.” Harvard Business Review April 2013 R3104C.

Parise, Salvatore, Eoin Whelan, and Steve Todd. “How Twitter Users Can Generate Better Ideas.” MIT Sloan Management Review (2015): 21.

Schlack, Julie Wittes. “HBR Web Article: Ask Your Customers for Predictions, Not Preferences” Harvard Business Review January (2015).

Sources:

1https://www.buzzfeed.com/craigsilverman/viral-fake-election-news-outperformed-real-news-on-facebook?utm_term=.nbR6OEK6E#.ghz5aZk5Z

2https://techcrunch.com/2016/05/26/most-people-get-their-news-from-social-media-says-report/

3https://yourstory.com/2017/04/faceboo-google-fake-news/

4https://www.ft.com/content/ba7d4020-1ad7-11e7-a266-12672483791a


Scorch!

                                                                                                       Scorch


Problem

Wildfires are getting worse each year. Acreage burned by wildfires and the number of wildfires burning more that 50,000 acres has continued to increase over the last 30 years.


Beyond the sheer devastation, forest fires are also a massive expense to the US government. Suppressing the fire requires hand crews, tankers, chemicals, and helicopters, not to mention firefighters. The fire management budget in the US is already up by 60% from a decade ago. More and more frequently, the Forest Service spends close to $2 billion per year on fighting fires.

Fire seasons have grown much longer, both in the US and across the globe. Earlier this year, more than 90 blazes scored 180,000 hectares, razed hundreds of homes, destroyed villages, cattle, and crops in Chile. As climate change continues to take hold, we will see more droughts and bigger and more severe fires will cause greater destruction of people’s lives and the economy of entire regions. CoreLogic estimates that US homes in the high or very high risk for wildfires could cost up to $237 billion to rebuild.


Opportunity

In the last decades, wildfire fighting has evolved by taking into account a more data driven approach to fighting, detecting and predicting these types of incidents. The first data driven models focused primarily on the study of weather. As the weather can determine how dangerous the fire can become, specialists started to analyze weather conditions during wildfires to fight them back.

Subsequently, other data were aggregated to build models for fire-behavior analysis to predict how flames will spread. Most of these models were reinforced with other data like the topography and fuel conditions, as well as smoke distribution forecasts. The problem of these approaches is that they look to mitigate the problem rather than prevented.

Then, the era of satellite imagery came and since then, satellite imagery has been used to try to detect forest fires. The problem is that it can not be used in real-time for fire prevention due to the amount of time needed to gather the data. In the same way, data from this type contain a high number of false positives for fires, ranging from hot asphalt parking lots to house fires to farmer burn piles.


What if we could use weather forecasting, topological data and real-time drone imagery to aid in forest fire protection?


Solution

Scorch will solve the wildfire problem with a technology that scouts fires before they flare up so firefighters can stop the flames early on. Evidence from Gamaya, a crop scouting company, and satellite imagery from NASA show that data science could effectively identify and detect fires. Scorch will use drones to fly over areas at high risk of wildfires and capture information through our hyperspectral camera (measures the light reflected Plants reflected by plants; reflection patterns change according to different stages in the life cycle and conditions of the plants). The image data will be processed through our algorithms that will be trained through crowdsourcing/ human intelligence tasks on Amazon Mechanical Turk and verified by fire experts. The results will be immediately sent out to the nearest fire station with recommendations to the firefighters and updates as the fire progresses.  As we collect more data, we will use machine learning algorithms to increase accuracy even further.


Concerns

One of the concerns is the frequency of false positives. Prior imaging software could falsely detect wildfires that are actually farmer burn piles or hot asphalt parking lots. This could lead to falsely deploying units that could actually cost more money. The Scorch algorithm would use historical fire perimeter boundaries and weather data to hone in on actual wildfires.


Another concern is the U.S. regulatory environment regarding drone use that might difficult initial testings. This could be solved by implementing the pilot program outside the U.S., notwithstanding this changes in international drone regulation might affect our ability to expand to relevant regions. This problem can be mitigated by working with authorities due to the public interest surrounding the problem that we are trying to solve.


Next steps and ask

In order to build this product, we need to hire developers and to set up crowdsourcing to train our imagery algorithm to properly focus in on wildfires. Additionally, we will do some testing to determine how much a drone could cover in order to be efficiently capture images useful for our purposes. In order to do this and develop our MVP, we are looking for a seed round of $150,000.


Sources

  1. http://www.cnbc.com/2015/08/19/what-the-wildfires-are-costing-us.html
  2. https://www.theguardian.com/world/2017/jan/25/chile-fire-firefighting-international-help
  3. http://blog.galvanize.com/fighting-forest-fires-with-data-science/
  4. http://www.popsci.com/year-wildfire#page-4
  5. https://github.com/sallamander/forest-fires
  6. https://www.ncbi.nlm.nih.gov/pubmed/12148070
  7. http://lias.cis.rit.edu/projects/wasp
  8. http://gamaya.com/

Women Communicate Better: Classy

Everyone’s familiar with a class-action lawsuit where a bunch of families get together to sue a pharmaceutical company. Well, class-action lawsuits can be filed by shareholders, too. When a company acts fraudulently by issuing misleading statements to investors or hiding negative information about their firm, they can cause economic injury to shareholders (since stock prices will generally drop upon eventual disclosure of the information.) When that happens, the primary means of recourse is through the legal system. These cases are called securities class-action lawsuits.   

The Problem:

Currently, there are a handful of firms that specialize in this type of litigation. These plaintiff firms basically throw bodies at the problem by keeping tons of lawyers on staff. These employees manually comb through the news, read reports from industry bloggers, and keep their eye on the stock exchange, hoping that they can identify a possible opportunity for a suit before one of their competitors. This is an incredibly time-intensive and inefficient process. If a suit isn’t identified immediately, it takes an average of 77 days for a plaintiff firm to file.

Since law firms invest so much manpower in the identification process, they are incentivized to only take on the largest companies with the highest potential settlements. The average market capitalization for firms targeted by securities class action suits in 2016 was $9.08 Billion. This means that plaintiff firms are neglecting to hold the majority of malfeasant companies accountable for their actions because either they’re not big enough fish or lawyers are simply missing these opportunities because fraud in smaller companies doesn’t dominate the news cycle.

These firms generally take a shotgun approach to bringing these securities suits to court, leaning on high frequency and volume over quality. Historically, 44% of all securities class-action suits are dismissed, meaning that the courts are being inundated with frivolous cases. And it’s increasing year over year:

*Source: Stanford Law School


The Classy Solution:

Instead of relying on plaintiff lawyers and industry blogs (like Lyle Roger’s The 10b-5 Daily) to manually scan and analyze stock price data, we believe there is an opportunity to use machine learning to drive a uniquely efficient, highly competitive plaintiff firm that can hold more corporations accountable for their actions.

We propose the creation of Classy, a revolutionary algorithm that utilizes machine learning and human input to classify and predict securities lawsuits.

Our value proposition is threefold:

1. Bring Suits Faster

The Classy algorithm will be able to identify potential suits much more efficiently than traditional means. Filing the strongest, most profitable suits before a rival firm gives our firm a huge competitive edge.

The more efficient the system, the faster we can hold companies accountable for their actions and address client grievances.

2. Cover the Whole Market

Classy allow the plaintiff firm to hold companies of all sizes accountable, not just the largest, most profitable ones. Using augmented perception, we can analyze the entire market for stock patterns that demonstrate the potential for a suit (something that is impossible to do manually).

The algorithm can also cover a much larger breadth of news sources than a human analyst. This gives us a better ability to match a news item with a companion drop in stock prices that captures the potential for fiduciary misconduct.

3. Choose Better Cases

Classy can reduce the volume of frivolous lawsuits that get filed by allowing the firm to better prioritize their staffing structure and redistribute their human and financial resources away from searching for potential fraud and towards suit selection and execution.

Once the algorithm has enough data, we can extend its functionality to issue a prediction score to the firm, which would encompass the likelihood of winning the case as well as the estimated settlement value. The plaintiff firm can use this tool to help guide them away from filing unsuccessful, unproductive cases.

A Classy Design:

Classy combines external sensors with machine and human algorithms to predict the likelihood of securities misconduct of various firms and help analyze the success of a suit.

1. Monitor stock prices (sensory input)

We would use supervised machine learning and deep learning to flag precipitous stock price drops throughout the whole market.

2. Track relevant sentiment (sensory input)

We would use natural language processing and sentiment analysis to analyze relevant news items, identifying patterns of negative disclosures by a firm in the past or public apologies issued by CEOs.

3. Predict Outcomes (machine algorithm)

These sensory inputs would then be analyzed by a machine algorithm, which would use the data to create a likelihood score of disclosure malfeasance by the firm and the predicted settlement value.

4. Supervise with experienced plaintiff attorneys (human algorithm)

This information would then be transmitted through a human algorithm – plaintiff lawyers with years of experience and relationship expertise – who would then verify and expand upon the potential suits flagged by the machine algorithm. They would also provide feedback to the machine algorithm in order to improve its efficacy and accuracy over time.

Action Steps:

Validation: We want to assess our hypothesis by using historical data to test the validity of our claims: that Classy can bring cases faster, with a lower margin of error, and extend to a broader set of companies.

Poach a Partner: Rather than offer Classy as an available service to all plaintiff firms (which could lead to a race to the bottom), we would like to partner with a set of experienced plaintiff lawyers and start our own firm. This will give us a competitive edge over rival firms and a greater potential to monetize our efforts.  

Start Bringing Suits!

Our Funding Target:

We believe that validation can be achieved in two months and we have budgeted accordingly:

  • Bloomberg Subscription:   $24,000
  • Dow Jones DJX Subscription:   $800
  • Two Months of a Developer’s Time: $25,000

     Total:                                                      $49,800


Sources:

http://securities.stanford.edu

https://ycharts.com/dashboard/

http://www.dandodiary.com/2017/01/articles/securities-litigation/2016-securities-lawsuit-filings-surge-record-levels/

https://10b5daily.com

SDR.ai – Your Smarter Sales Assistant (Team CJEMS)

SDR.ai: YOUR SMARTER SALES ASSISTANT

AUGMENTED INTELLIGENCE FINAL PITCH

TEAM CJEMS

I. Executive Summary

Business to business (B2B) sales continue to grow rapidly, but the services available to improve the process and success rate have been slow to keep up. As an intelligence platform that enhances the sales process, SDR.ai is here to change that. SDR.ai helps companies personalize customer messaging and better leverage data, resulting in improved sales results with less spending on internal resources.

II. The Problem and Opportunity

Sales Development Representatives (SDRs) help companies find and qualify sales leads to generate sales pipelines for Account Executives, who work with the customer to close deals. SDRs are a vital part of the sales process, as they weed out people that will not buy to find the ones that likely will, but their work is often repetitive and cyclical. SDRs work with large data sets and follow a clearly defined process, making them ideal candidates to integrate aspects of their jobs with automation. While it is still on the human SDR to understand the pain points of the prospective customer, an opportunity exists to better personalize messaging and make use of the available data to increase the final close rates for sales teams. Current SDR emails already utilize templates, but they do not consider what works and what doesn’t, and while it is possible to analyzing open / click rates of emails, linking this to revenue, or even spending time tweaking emails to add extra personalization, detracts from the time SDRs could spend on the phone with customers.

III.  Our Solution

SDR.ai aims to solve this problem by creating emails that mimic what actual SDRs sound like, without the template, considering the available data on what works vs. what doesn’t. It will integrate with existing popular CRMs, including Salesforce and Microsoft’s CRM, to learn from previous email exchanges and aggregate data in one place. Messages can be personalized to the recipient to create a more authentic message. Additionally, and most importantly, SDR.ai can send many more messages, increasing the volume of potential leads and the chances of bringing in additional revenue.

After initial training and manual emails, SDR.ai will continue to build smart responses, with the goal of handling everything up except phone calls, including scheduling and even finding the right person for SDRs to email from a prospective company (by using integrations like LinkedIn and Rapportive). Unlike real employees, SDR.ai is online 24/7, thus making it easier to connect with clients abroad, who normally must take time differences into account, losing valuable time and creating even longer sales cycles.

IV. Target Customer

SDR.ai is ideal for mid-market, high-growth small to medium businesses seeking increased sales and better conversion rates. More specifically, we are targeting B2B software-as-a-service companies (SaaS) that have defined sales processes that include a focus on inside sales. These types of companies are typically much more reliant on inside sales (37% of high-growth companies use inside sales as primary sales strategy). Moreover, many often lack the financial and human capital resources that make them ideal target customers for SDR.ai.

V. Business Model

As a software business, we will rely on a subscription-based business model that will also offer add-on consulting services to customers. On average, compensation for an SDR is high, with a base of $46k and an OTE variable comp of around $72k. Our pricing, therefore, will be based on our ability to reduce overhead spending on SDR’s and our ability to increase revenue per SDR.

VI. Product Development

We will first build a minimum viable product (MVP), focusing on developing initial automatic email creation, Salesforce integration, ability to send a high-volume of messages, and 24/7 availability capabilities. We plan to pilot SDR.ai after an MVP is created to gauge early feedback. To ensure we collect enough data to make the prototype of the product useful and accurate, we plan to partner with software (SaaS) companies that handle a large volume of leads. Given that this product can be tied directly to revenue generation, companies will likely be willing to try the prototype. From here, we could collect data on the most common language used, tied to deals that have been closed historically. By integrating with popular CRMs like Salesforce that already store historical data and emails used, we can determine how many emails on average it takes before deals are progressed from the SDR to the Account Executive. We also can take things a step further by looking at what is useful across different industry verticals, as CRMs already store this type of information.

After the pilot runs its course for a month or so (or whatever the average sales cycle length is), we can review the validation of the emails that were created with SDR.ai compared to those that were not. In short, we can validate that emails were (a) more readily responded to by either picking the right person in the organization (i.e. less emails that pass SDRs from one employee in a prospect client to another) and / or due to shortened response times or (b) opened and responded to by analyzing the language used in each response. The language can be continually refined and tweaked based on #2 until SDR.ai finds the right optimization of length, follow up, and personalization.

VII.  Competition

Currently, no direct competitors exist. Instead, there are three categories of potential “competitors.” Existing legacy CRM and sales management software providers do not provide the AI-enhanced capabilities of SDR.ai and will not move into such offerings, as they are focusing on their bread and butter offerings. Companies that offer predictive marketing software are growing, but they currently offer no clear solutions for sales teams. Finally, sales automation solutions providers provide valuable automation tools, but lack the AI-powered learning that SDR.ai would provide companies.

 VIII.  Risks and Mitigation Strategies

We believe SDR.ai can be an industry catalyst and fundamentally transform sales at large corporations. We recognize, however, that there are a few key risks we must assess and mitigate.

First, CRM providers such as Salesforce could potentially develop their own AI solution and effectively integrate it into their CRM offerings. To successfully mitigate this threat, we propose a two-part plan. First, SDR.ai will immediately file for patent protection in order to prolong our first mover advantage in order to secure as many customers as possible. Second, we will spend the coming years investing in an intuitive UI and integrating with customer databases outside of traditional CRM (e.g., BI tools). This will make customer switching costs higher and help address competitive threats.

Second, as a new platform SDR.ai may face scalability risks. Specifically, customers may find that the platform works well when their sales organization is smaller but that it fails to effectively scale as the database grows. In order to mitigate this, we propose a carefully designed pilot program that chooses rapidly growing companies. This strategy coupled with investment in a talented engineering staff will help address this risk. SDR.ai will not commit to aggressive growth until the pilot program demonstrates that the technology can effectively scale.

VIII. Investment Ask

We’re confident that we have the right team and resources to bring this product to market and grow the business; however, we are seeking $300,000 in seed funding to hire additional engineers to continue to build and refine the SDR.ai offering. While we have the correct business team in place, in order to bring this product to fruition, we need additional engineering resources.

 Sources

http://blog.persistiq.com/the-rise-of-sales-development?

https://www.salesforce.com/blog/2014/08/what-is-sales-development-gp.html

https://www.saleshacker.com/day-life-sales-development-rep/

https://resources.datanyze.com/blog/preparing-for-future-without-sdrs