This post is an installment in an ongoing series that explores possibilities for creative classroom assignments. We will showcase courses that have successfully employed creative assignments, and introduce tools and strategies that can help your students master material more fully and deeply, along with helping you to assess their knowledge and skills.
Previous installment: Podcasting
Why use creative assignments in the classroom?
Creative assignments fall into two broad categories: formative and summative. Formative tools, such as collaborative mind mapping, allow students to explore ideas and concepts, systematize their thinking, and make progress toward mastery of new concepts. Meanwhile, summative assignments can offer students the chance to create a lasting artifact that they can share with others, giving them a sense of meaningful accomplishment. Such assignments are often both high- and low-stakes; they make it easy to hold students accountable for content mastery without adding large amounts of extra work. Whether plotting a map, constructing a timeline, recording a podcast, or making a video, your students will be able to combine traditional academic research with practice in flexible, innovative thinking.
Those students who are less comfortable with the constraints of academic writing may find the challenge of creative assignments to be uniquely stimulating. In addition, thanks to the many software tools now available for pedagogical use, your students can collaborate to create attractive, compelling projects, even when they are not in the same physical space. In the process, they will acquire technological skills and competencies that are of great value in today’s wired world.
Map Exercises
Maps reach far beyond geography. The movement of people, things, and ideas plays a role in countless intellectual disciplines. As an easily understandable visual representation of such movement, maps can allow you to detect relationships and trends that purely abstract data might conceal.
In the past, the use of maps in the classroom has largely been limited to show-and-tell, but digital mapping tools have brought about a pedagogical revolution. Students can make their own maps, “pin” information such as text captions or audio clips to locations on their maps, and, with certain tools, even track movement through space.
A number of easy-to-use tools for digital map-making are readily available. Google’s GSuite includes My Maps, a powerful, intuitive app that allows you to select from multiple types of underlying map (political, satellite, terrain, etc.) and plot points or lines/routes. You can make your map interactive by adding notes with text, images, video, or external links. You can also create a Geo chart within Google Spreadsheets; simply open your spreadsheet and choose Insert -> Chart, then choose “Geo chart” or “Geo chart with markers” under Chart Type. Geo charts are valuable for converting numerical data into an easily comprehensible geographical picture. You can also create three-dimensional, immersive tours using Google’s Tour Creator.
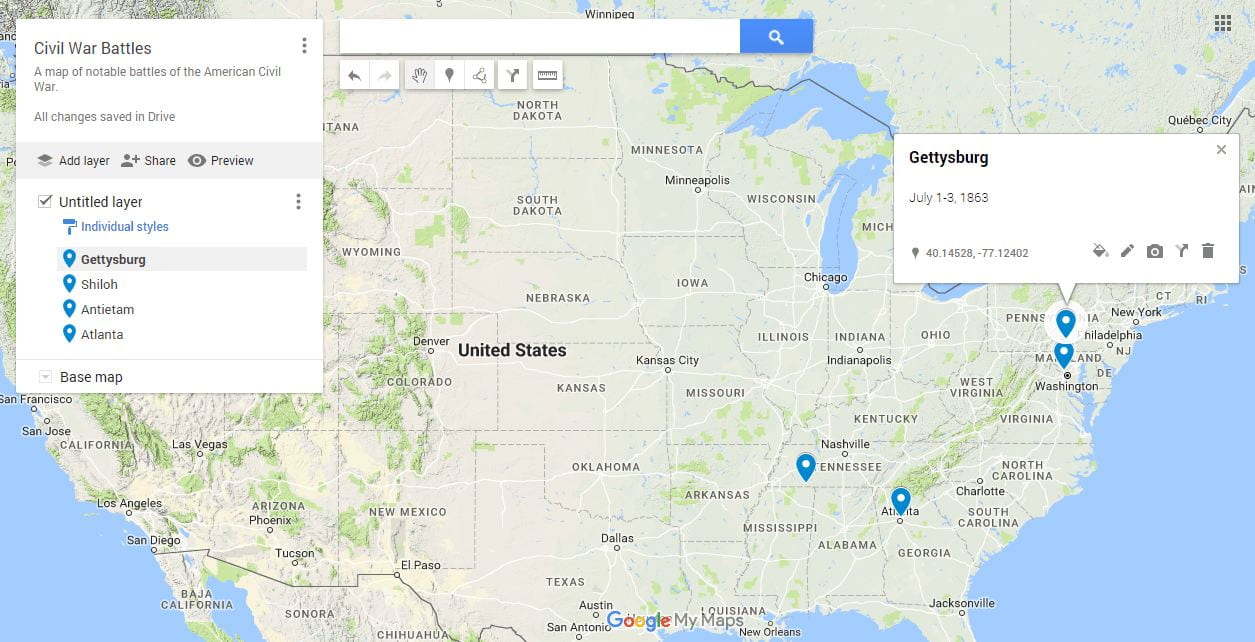
A map of notable Civil War battles, created with Google Maps
Faculty and instructors at many major universities have had success with map assignments in the classroom. Prof. Julia Gossard, now at Utah State University, introduced a map exercise into her course “Global Early Modern Europe” at the University of Texas at Austin to help her students see how early modern Europe interacted with the peoples and nations beyond the borders of the continent. Not only did her students learn, through the process of mapping, some of the basic truths of early modern life – e.g. the great distances and lengthy times involved in voyages by sea – but the collaborative process of building a map and tracing connections brought the subject to life in a way that her students found enjoyable and fascinating.
Here at the University of Chicago, faculty members Niall Atkinson and Patch Crowley, both in the Department of Art History, have used digital maps in their courses to help their students contextualize art and architecture within their physical/spatial environment. Prof. Atkinson was able to show his students the path that the marble used in Michelangelo’s sculptures took from the quarry to the sculptor’s studio, emphasizing the physical process of sculptural production and the costs and labor involved. His students also built a collaborative map of Renaissance architecture. Prof. Crowley used images from Google Earth to introduce classroom discussion on how we use and interpret images, paying particular attention to the ways in which electronic media filter our perceptions and affect our viewing process.
Prof. Niall Atkinson discusses his use of mapping and graphical visualization tools in art history courses.
Further Resources: Maps
- Ditch That Textbook offers creative ideas for exercises with Google’s My Maps app.
- See also Richard Byrne’s “How to Use Google’s My Maps in Your Classroom”.
Timeline Exercises
Just as map exercises allow students to contextualize how people and goods move within space, so timeline exercises allow them to contextualize movement and change over time. Unlike a paper timeline with its static string of dates, a digital timeline allows for interactivity: students can “walk” through a timeline and see how events in different parts of the world or different arenas of thought overlapped, or view media attached to dates (still images, audio, video) to engage with history in a rich way and learn content through multiple modes.
Many tools for digital timeline creation are available. TimelineJS, from Northwestern University’s KnightLab, allows you to set up a basic timeline with nothing more than a Google Spreadsheet, add media from popular sites (e.g. Twitter, Flickr, YouTube, or Vimeo), and embed the code for your timeline in a webpage or blog to display it to the world. TikiToki, another Web-based software platform, offers options such as banded timelines (multiple timelines displayed in parallel, making comparison easy) and 3D timelines. As a simpler, quicker option, you can also create an annotated timeline as a chart type using LucidChart’s timeline template. Because Google Suite is engineered to make collaboration easy, this option works well for group assignments.
A sample timeline created with TimelineJS
Timeline exercises are increasingly being used in higher education in creative and stimulating ways. In her “Foundations of Western Civilization” course at Utah State University, Prof. Julia Gossard has her students create a timeline of the history of food, using TimelineJS, so they can understand the vital role that agriculture and fluctuating food supplies have played in the course of human history. Here at the University of Chicago, the students in Christopher Dunlap’s Spring 2016 LACS course “Sciences as Solutions to Latin American Challenges, 1500-2000” used TimelineJS in conjunction with the University’s blogging platform, Voices, to build an interactive, multimedia timeline of the history of science and technology in Latin America (site requires CNetID and password to view).
Further Resources: Timelines
- Vanderbilt’s Center for Teaching offers valuable advice on how to craft effective timeline assignments.
- For practical insights into what makes timeline assignments successful, see also Derek Bruff’s “Timelines, Ed Tech, and Thin Slices of Student Learning”.
Getting Help and Next Steps
If you are interested in using a map or timeline exercise in your classroom, contact Academic Technology Solutions (academictech@uchicago.edu) for help. ATS instructional designers can help you create exercises that support your broader learning objectives and select the appropriate software tools to use in your class.
