
Here’s one for the Annals of Unpublishable Data. I wanted to see if using the unmixing algorithm on data acquired on traditional instruments would help resolving GFP and YFP without using a special filter set. Turns out it doesn’t, and that’s pretty sad. But if you read on, I’ll make it up to you by showing how to use the FlowJo unmixing algorithm on data picked up from a traditional instrument.

Cytek Spectral viewer, emission of GFP in blue, and YFP in red.
GFP and YFP are a pair of fluorescent proteins that some unlucky souls have to deal with within the same animal or cell model. They are best excited by the 488nm laser and emits at roughly the same wavelength so both signals end up in the same detector. If we want to deal with them on a traditional instrument (non-fully full spectral flow cytometer), we’ll get a special filter set to split them apart and send them on their specific merry detectors – say a 525nm LP dichroic, a 510/20 bandpass for GFP, and a 550/30 bandpass for YFP. Look below – it usually looks pretty nice.

Cells expressing GFP or YFP, data compensated. GFP collected with 515/20 BP filter, YFP collected with 540/30 BP filter.
It’s a bit of a drag though, the filters are expensive, not everyone has them, and using them sucks the fun out of life. No wonder several researchers tried to use specific properties of these two fluorescent proteins to separate the signals some other way. Marcus and Raulet suggested using the emission of GFP when excited by the violet laser with acceptable results. It wasn’t great to separate cells coexpressing both molecules, but did nicely enough for single expression.
The question I had was wether unmixing would improve the resolution of these molecules. So tested it out with two cell lines expressing both GFP and YFG (at very high levels) and ran those on a 4 laser Fortessa. All detectors were used to measure the signals. We measured GFP and YFP first with the special filter set described above, where both GFP and YFP are excited by the blue laser line. The second data set was collected using the baseline filter configuration (see here), and GFP was picked up from the violet laser 525/50BP, and YFP form the 488nm laser 530/30BP. This second data set was analyzed first with compensation between the two detectors used for GFP and YFP, then using the FlowJo unmixing algorithm.

Overlay of GFP or YFP expressing cells in red. Cells co-expressing GFP and YFP are in blue. Data acquired on a LSRFortessa, GFP picked up on the violet laser 525/50 detector, YFP in the blue laser 530/30 detector, compensated using FlowJo.
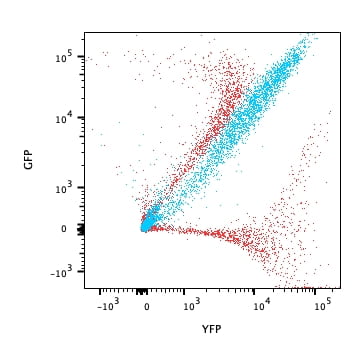
Overlay of GFP or YFP expressing cells in red. Cells co-expressing GFP and YFP are in blue. Data acquired on a LSRFortessa, GFP picked up on the violet laser 525/50 detector, YFP in the blue laser 530/30 detector, unmixed using FlowJo.
As you can see, the tested and true GFP/YFP filter set provides the best resolution between the two populations. Unmixing allows us to somewhat better separate the cells coexpressing GFP and YFG from single expression counterparts, but it’s nothing I’ll call my mother about.
Of course, unmixing on an actual flow cytometer optimized for spectral flow rules. Unmixing looks clunky here because the cells are hyper bright and controls may have been off a bit.

Cells expressing GFP or YFP captured on the Aurora. Data unmixed.
Still, you can check the video on the side to see how you can use the unmixing algorithm on you traditional data. The key thing is to record data from all of your detectors, and removed the unused parameters form the list in FlowJo – that is any detectors that doesn’t not contain a primary peak for your fluorophores.
Check out Laura’s post about setting your gates when using a compensation or unmixing wizard.
Thanks to Katerina Cheronis for all the cells!

0 Comments