Hi-Per! (Latest in AI from HiPo!)

Problem/Opportunity

Through legislation and lifestyle changes, consumers on average are becoming more aware of the good and bad of what they’re eating (e.g., calorie counts in states that require listing at chain restaurants), but there’s currently few ways for people to track how their diet and lifestyle truly impacts their health. Fitness monitoring has increased in popularity through the proliferation of smart devices, but there’s no automated equivalent for monitoring your diet, and even if you manually log everything you eat, it’s nearly impossible to know how your body reacts to certain foods, and if your body is getting everything it needs.  


This is a problem and opportunity that reaches across age ranges and demographics.   A solution that provides seamless nutritional monitoring and recommendations based on dietary shortfalls and user habits/behaviors that adjusts based on learned preferences could benefit everyone.  For example, even with rigorous food tracking, elite athletes can’t truly tell if they’re getting adequate levels of, say, the eight essential amino acids.  Cancer patients or those in remission don’t truly know if they’re getting enough Vitamin C or D.  Diabetics can currently monitor their glucose levels, but could be at a loss in terms of what else they should be tracking.  Everyday consumers may be falling short on certain vitamins and minerals, but aren’t aware of their impact or how to close those gaps.


Solution

To address the opportunity described above, we would like to reintroduce HiPo! and its next line of product, Hi-Per!. Hi-Per! is designed to continually monitor key nutrient levels in the human body and provide feedback in the form of food consumption recommendations and alerts that ensure individuals maintain optimal levels of health.


Recent developments in technology have expanded the possibilities of how sensors are used to evaluate health and wellness attributes. While existing sensor technology focuses on measuring nutrient levels of food items, we believe that the application of this technology to nutrient levels and other health metrics of an actual individual is a viable next step. Hi-Per!  is housed in wearable (and fashionable) wristband sensor that uses infrared spectrometer technology to make periodic measurements of the user’s vitals and nutrient levels. This information is sent to the Hi-Per! application which is accessible on the user’s mobile device.


The application itself leverages a machine learning recommendation algorithm to evaluate the user’s vitals and nutrient levels, alert the user of any deficiencies, and suggest preferred foods to remediate those deficiencies. The algorithm is built upon a database of inputs, including: (a) benchmark vital and nutrient level data for different user profiles based on sex, age, and weight; (b) nutritional data on food and drinks; (c) research data on the metabolic profiles of both individuals and foods. Using these inputs, the algorithm will be designed to optimize a user’s food and drink consumption based on their nutrient needs, taste preferences, and individualized food digestion traits (i.e., metabolic behavior). The user will be able to log what food and drink has been consumed in the application, providing a feedback loop that will further optimize the user’s health and wellness profile.

Pilot
We conducted a pilot study on 10,000 pregnant women. A recent study showed that prenatal vitamins do not have benefits for women and their unborn children as advertised and, instead, pregnant women should focus on improving the overall quality of their diet to reduce complications related to birth and pregnancy from vitamin deficiencies. Yet there are many dietary restrictions placed on what women can consume during pregnancy. Given the heightened health awareness, benefits of optimal vitamin levels, and dietary restrictions, pregnant women represent an ideal customer base to test our technology. We focused on optimizing the top 8 nutrients pregnant women need: iron, calcium, vitamin D, folate, protein, zinc, iodine, and omega 3-fatty acids. The results drastically showed how Hi-Per! was able to improve vitamin levels in pregnant women to minimize birth defects and pregnancy complications. For example, abnormal bone growth, fractures, and rickets in newborns decreased in prevalence by 65% against control groups (attributed to vitamin D levels).


Sources:

https://www.fastcompany.com/3030342/this-tiny-device-fits-on-your-keychain-and-measures-the-calories-in-your-dinner

http://www.livescience.com/55363-prenatal-multivitamins-dont-help-much.html

Gift Hero: Using the Wisdom of the Crowd to Gift Smarter

Choosing the right presents can feel like a challenge at times. Christmas and birthdays are the perfect opportunity to spoil your friends and family and show you care. At the same time though, if you are not confident about choosing the right present, it can feel pressured and difficult. Around Christmas, economist will inevitably talk about the deadweight loss of Christmas gift giving, a theory by economist Joel Waldfogel. Deadweight loss occurs because of the mismatch between what a gift giver thinks a receiver wants and what the receiver actually wants. Expanding this concept to the whole economy, Waldfogel found the gift giving deadweight loss is 10 percent. Given that Americans are expected to spend about $600 billion on holiday gifts each year that would put the amount of deadweight loss at $60 billion. What are the proposed solutions for reducing this loss? Cold hard cash in an envelope. But, that solution feels too practical and lacking in holiday spirit. Fear not, it is possible to turn into a present buying extraordinaire; you just need to use Gift Hero.

Gift Hero is the service you can turn to when you need a personalized gift recommendation. Rather than using Amazon, which will recommend the same gifts everyone else is giving, Gift Hero matches gifters with expert gift recommenders. Not sure what kind of earrings to get your girlfriend who is into owls? Not that knowledgeable on earrings or what constitutes a cute vs. ugly owl? Get recommendations from someone with your girlfriend’s tastes so you don’t pick the set that is “too owly.” Gifters post the occasion, their budget, and the interests of the person receiving the gift.


Potential recommenders can review a list of these events, find events that match their profile, and suggest a personalized gift idea. The gifter can review the suggestions, rate the quality of the suggestion, and approve or reject the gift.

If their idea is used, recommenders get paid, with the rating system in place to identify and remove bad recommenders. Gift hero takes the stress out of choosing gifts by finding the perfect person to recommend the perfect gift.

To demonstrate the effectiveness of our product, we will run a trial with a group of 200 gifters and recipients.  We will attempt to create a varied and balanced sample of participants, representing a range of ages, budgets, and tastes.  We will then randomly assign participants to either the control group or the “Hero” group.  The control group will be asked to pick a gift for their recipient using whatever methods they would normally choose.  The Hero group, however, will be given the GiftHero product to aid in their gift selection.  We will survey both the recipients and the gifters about their experience.  We will measure 1) the percentage of those in the Hero group who chose to gift a product recommended by the product; 2) the difference between gift satisfaction rating of recipients in the Hero and control group; 3) the difference in amount of time taken to select a gift between the Hero and control group, and 4) the reported willingness to pay for the product among gifters in the Hero group.  We are confident that our product will demonstrate value along all of these dimensions.

Over time, we expect that the recommenders will organically increase and the reviews will self-select the best. We believe that there is a lot of value is created and hence extractable. Successful recommenders can be paid per recommendation with a commission being paid to Gift Hero. Further, similar to Amazon Prime, a subscription can be paid to be part of the Gift Hero members list. Further, we believe another channel of revenue is through affiliate marketing. Clearly, it is a natural extension to the business to direct consumers to e-commerce website and obtain the affiliate fee. Finally, we believe that the data that Gift Hero is extremely valuable. This can be monetized through contextual marketing as well as recommendation analytics. The overall revenue potentially runs into at least a billion dollars within the United States.


Team Codebusters

Augmented Sensing in Commercial Aviation

Connected Aircraft


Problem

Commercial aviation is by its nature a very data-rich business. All aspects of an average airline flight, from passenger and cargo information, to flight operations data, to maintenance and component health data, are potential sources of value for airlines, which compete in a tight margin business. This data has been collected in some limited form for years, but new aircrafts, such as the Boeing 787, have revolutionized the ability for airlines to start collecting massive amounts of data that previously went uncollected. The 787 collects up to half a terabyte of data per flight from a suite of on-board sensors, including engine diagnostic sensors, brake health indicators, and flight controls movements. The addition of augmented sensing to the aviation business has the potential to reduce airline costs and increase the quality of service to consumers.


Current State of the Industry

The industry is currently using this data primarily to predict when components will need servicing, reducing flight delays for maintenance. Sensors onboard the aircraft collect data related to the health of airline components, and feed this data back to the airlines, who can proactively plan when to take a plane out of service, rather than discovering these issues at the gate. This data is also being used to help manufacturers build better parts, and more accurately predict future planned maintenance schedules. They can then build upgraded parts for existing planes in service, reducing maintenance cost and improving the performance of the airplane. One issue with the current state is low-bandwidth available to airplanes in flight, as legacy systems typically only have a bandwidth of 10-15 kbps during flight. Airlines can bypass this currently either by upgrading to higher bandwidth satellite connections for inflight data transmission, or downloading data after a flight when faster ground-based connections are available.


Future Opportunities

While the industry is primarily using this data for predictive maintenance purposes now, this data could be used in a wider context, using machine learning algorithms. One area where machine learning could improve efficiency is in flight optimization. Each flight generates an enormous amount of data regarding the decisions the pilots make when they fly the plane. While this data is difficult to analyze, given the huge number of variables, including air traffic control instructions, weather conditions, and airplane design, machine learning could help sort through the data. A neural-net style algorithm could analyze all of the available flight data, and build models of the most efficient pilot decisions. These decisions include when to use flaps in landing, what power settings to use, and what cruising altitude is optimal, given the weather conditions. Once this data is analyzed, airlines can communicate new guidelines to pilots to increase the efficiency of their operation.


Another application would be to integrate an optimization algorithm into the current predictive maintenance scheduling system. Airlines don’t have every spare part available at every airport they serve, so integrating predictive maintenance data with flight schedules and part availability data could allow an algorithm to determine the most efficient time and location for an airplane to be taken out of service. This would save airlines from having to perform costly repositioning flights as airplanes are flown from a maintenance hub back to where they are needed in service.


Finally, airlines could use algorithms in real-time to help pilots navigate the most efficient routes to their destinations. Airlines could take airplane performance data from previous flights and integrate that data with current weather data and air traffic control information to plot the most efficient route for an airplane to complete its journey. This would be especially useful in navigating around storms, since current guidelines instruct pilots to fly well clear of them in a boxy pattern determined before the flight, instead of flying the most efficient route to clear a storm cell as it moves. The addition of Big Data machine learning and optimization algorithms to the new-found wealth of data in the aviation industry could unlock billions in value for the airlines, and provide a better flying experience to the general public.


Sources

http://www.aerospacemanufacturinganddesign.com/article/millions-of-data-points-flying-part2-121914/

http://aviationweek.com/connected-aerospace/getting-ready-big-mro-data

http://www.computerworlduk.com/data/boeing-787s-create-half-terabyte-of-data-per-flight-says-virgin-atlantic-3433595/2/

ApartMatch (Pitch)

Background on the Problem

Apartment rentals have been increasing throughout America. In Chicago alone, there are over 300,000 apartments that constitute the housing stock. In 2016, approximately 40% of renters in the Chicago area decided not to resign their lease and look for new apartments. That means over 100,000 apartments that enter the rental market every year in Chicago alone. For individuals seeking a rental unit, the sheer number of available apartments can be daunting. Some experts recommend that apartment seekers should visit 5-7 apartments a day, making for a very time consuming and complex process. Current websites, such as Zillow.com, allow searches to screen and filter results, but more often than not there are still a large number of apartments that may match the search criteria. Therefore there is a need to develop a solution that can cut down on the stress and time required for a successful apartment search.

Description of the Solution

Our solution will generate a targeted set of property listings for consumers that align with their taste profile and preferences. This will solve the issue that many consumers face with being overwhelmed by the multitude of listings on sites such as Craigslist and Zillow, and instead will generate a high-potential list of properties that users will be interested in viewing and ultimately renting/buying. Users will generate a simple profile in which they indicate some basic criteria regarding what they are looking for (e.g. “suburb of Chicago,” “2 beds/2bath,” “$3k/month or less”), and then they will be prompted to “rate” ten different property listings (note: number subject to change based on test results). The algorithm will then match them with listings based on comparing them to other users who provided similar ratings.

The key difference between our solution and a matching algorithm such as Cinematch is that our solution needs to provide different suggestions based on location. Therefore, we would need more “humans in the loop” to train the algorithm on how to provide similar types of suggestions across disparate data sets. Initially, the additional humans in the loop would come in the form of hired realtors and/or interior designers. We would show them a set of listings that a particular user indicated that they liked, and they would choose additional listings to recommend to the user. Upon reaching a critical mass of active users, we would phase out the use of experts, and rely solely on an increasing number of user ratings to provide the best recommendations. The algorithm would be based both on initial user ratings and additional data on actual rental decisions. We believe having a large number of users will create a network effect in the form of high quality recommendations, so by being first to market and reaching a large enough user base we will be able to fend off competitors attempting to replicate our product.

Empirical Demonstration

For our empirical demonstration, we will pit our product against a real estate agent and see who produces the best suggestions. Users will create a profile on our platform, including rating an initial set of properties. The user will also meet and discuss their desires with a real estate agent. Our application will generate ten recommendations, and the real estate agent will provide ten recommendations. The user will be shown these 20 recommendations in random order, and select which recommendations they are interested in. We will quantify the success of our application compared to the realtor in terms of how likely individuals were to like suggestions from each source.

Pilot

For our pilot, we will launch the product in Chicago. As mentioned, we will need expert feedback from realtors to initially train our model, and there are several we have in mind to cooperate with, including Mark Allen Realty, Dream Town Realty, and Chicago Properties. To source the apartment listings, Zillow has a light and user-friendly API available for public use. We will also have access to Chicago accelerators such as Polsky Center to ensure we reach a wide audience for a successful pilot.


Team: Shallow Blue
Members: Will Thoreson-Green, Curt Ginder, Holly Tu, Tom Kozlowski, Ram Nayak
[1] http://www.nmhc.org/Content.aspx?id=4708#Large_Cities
[2] http://www.chicagotribune.com/business/ct-renters-re-signing-leases-0520-biz-20160519-story.html
[3] http://streeteasy.com/guides/renters-guide/finding-an-apartment/

Sift Science: Detecting Online Fraud

Online Fraud: A $16 billion Issue

Online fraud and account takeover is a growing problem for retailers, financial institutions, online merchants, and payment providers.  Estimates say the problem may cost retailers and consumers more than $16 billion annually.  Security breaches, such as the one at Yahoo, among others, have led to leakage of millions of login/password data records which can be leveraged by fraudsters to access online wallets and other accounts that are linked to stored payment information. This is extremely dangerous because it is difficult to distinguish between legitimate and fraudulent online transactions. To combat the perpetually growing problem, San Francisco-based Sift Science, launched in 2011 with a mission to ‘make online experiences faster, smoother, and safer using the smartest technology around’, is attempting to solve the problem through pattern recognition and machine intelligence. 
More and more businesses worldwide are relying on Sift Science to automate fraud prevention, grow revenues, or slash costs. Their cloud-based machine learning platform is powered by 16000+ fraud signals receiving real time updates from a global network of 6000+ websites and apps and allows them to provide 10X results compared to other solutions. For instance, Sift Science has helped Opentable, an online restaurant reservation company,  improve detection accuracy by 200%.

Sift Science: Leading Fraud Detection

Apps worldwide send records of key activities in real-time to Sift Science using javascript snippets and APIs. Key activities include when: orders are submitted, user accounts are created, users login/logout, items are added to the shopping cart, user-generated content is submitted, or when messages are sent.  Sift Science aggregates a database of these activities together with third party data such as social media profiles, email domains, or IP geolocation. Fraudulent signal features and patterns are identified, taking into account unique fraud signals by industry or business type. Algorithms factor in the relevant features and calculate a Sift Score, which is effectively a probability that the user or transaction is fraudulent. In partnership with Sift Science, clients set Sift Score thresholds to block risky users and transactions. The solution is particularly useful in instant-fulfillment ecommerce applications.

Sift currently works with many small to midsize companies in the online retail space such as Yelp, AirBnB, Wayfair, HotelTonight, etc and has demonstrated commercial viability in this market. The company currently competes with others on a variety of dimensions. There are old fraud prevention systems such as CyberSource by Visa or Accertify by American Express, other cybersecurity vendors that include credit card as one of many services including Palantir and SAS Institute, fraud prevention models through payment providers such as Braintree, and other fraud prevention startups such as Riskified and Feedzai. Traditional fraud prevention technologies are rules based which Sift Science improves upon by using real time machine learning models trained on each customer’s data to pinpoint which factors related to a transaction are most likely to be fraud. An important part of the Sift Science system is that it gets better over time with the help of a fraud analyst or other employee who helps to train the system by identifying false positives and false negatives. The company says that they have an average false positive rate of only about 20% as compared to an industry average of about 80%.

While Sift currently seems to be focusing on customers that are online only, other startup competitors such as Feedzai are able to implement multi-channel fraud solutions which means that Sift will face competition when trying to expand to markets involving physical locations. Similarly, Riskified focuses on international transactions which could be another hindrance to Sift Science’s expansion plans. It is likely that there will be consolidation in this space over time, as these companies are using similar technologies and strategies to target niche parts of the market.

Potential Improvements

One idea for improving the Sift product is to build a platform that allows both customers and non-customers to share data.  Currently, Sift customers benefit from the fraud detection algorithms built using their own customer data and other generic attributes, but they cannot identify if a customer’s identity has been compromised outside of the Sift network.  By allowing other entities such as banks or credit card companies to share information, they could develop a more comprehensive view of customers and potentially catch fraud earlier.  If the data sharing is reciprocal, the groups contributing data would also benefit by getting access to more information.  This type of agreement is already in place at many banks in the United States, and could be a competitive differentiation for Sift if structured correctly.


Team: Cyborbs

Members: Alisha Marfatia
, Paul Meier, 

Sakshi Jain, Scott Fullman, 

Shreeranjani Krishnamoorthy

Teamwork makes the dreamwork

Big Health

Opportunity:

Healthy eating has come front and center in consumers’ minds. Half (49%) of global respondents believe they are overweight, and half (50%) are trying to lose weight1. And they’re willing to pay to achieve that goal with consumers paying an average 38% premium for healthy alternatives1. However, today’s consumers lack an accurate and easy way to determine how what they’re about to eat will impact their health, both in the short and long-term. The only out-dated technology that exists today (nutrition labels) is hard to translate to your individual portions, not easy to keep track of, and only available for pre-packaged foods (vs. food in restaurants, for example). So, although consumers know a cheeseburger is not the healthiest choice, since they don’t know exactly how unhealthy it is – they will choose to eat it anyway. And these instances add up over time.


Novel augmented intelligence solution:

We, at Big Health, are building the solution to all of these problems. Our hypothesis is that by delivering nutrition facts in an easy-to-consume (i.e. smart dashboards) and salient (i.e. clear impacts on health) way, consumers will be able to fight the urge for that cheeseburger and instead grab a salad. With our app, you can simply snap a picture of food and we will tell you:

  • The nutritional facts
  • Potential impact on health
  • Healthier alternatives

We are able to achieve this through our advanced image recognition algorithm. This algorithm has been trained on photos of food pulled from Facebook, Instagram, and other social media sources and can can recognize the individual components of a dish (e.g. chicken, noodles, etc.). Using the size of the food to estimate portions, the app can now tell you the precise nutritional facts of each component. A separate algorithm will use health care data from millions of patients to show you your overall health picture with specific risks called out. Based on the underlying causes of your health situations, we will tell you whether or not a particular food is risky because of its ingredients. Then, using another model that can simulate the taste of a certain food based on its chemical make-up, we will serve you recommendations for similar dishes that hit the same taste metrics. Armed with all of this information, we believe consumers will start to make healthier choices.

Our plan is to sell this technology as a per user license to health insurance companies and to companies that want to support the health of their employees. Additionally, we will open up another revenue stream from restaurants that want to advertise their healthier alternatives on our platform.


Design of empirical demonstration:

We will conduct a study in which we track food consumption across two equally sized and similar sets of users with the test set utilizing the Big Health program and the control set eating as they normally do. The study will be run for a period of sixty days and at the conclusion of the study we will measure average daily calories consumed, macronutrients consumed (protein, carbohydrates, fat), and analyze the overall health quality of food consumed using metrics such as glycemic index and levels of healthy vs unhealthy fats. A successful outcome would be a materially improved health profile of the food consumed by the target group. We will also assess consumer happiness through the use of a variety of daily surveys surrounding areas such as energy levels and overall happiness surrounding food choices.


Pilot to reveal its plausibility, promise and appropriate value


The pilot will utilize the data obtained in the empirical demonstration in order to build a model to predict the long term positive health impact expected from improved food choices over a longer time period. In this manner, we can quantify the direct benefits to health insurance companies and larger corporations. On the health insurance side, we anticipate a significantly reduced percentage of obesity in patients which will reduce the likelihood of costly health issues such as heart disease and type two diabetes. On the corporate side, we will utilize the data to show the expected increase in worker productivity due to higher levels or energy and focus and a reduced amount of anticipated sick days.


Source

  1. https://www.nielsen.com/content/dam/nielsenglobal/eu/nielseninsights/pdfs/Nielsen%20Global%20Health%20and%20Wellness%20Report%20-%20January%202015.pdf

The Next Rembrandt – Recreating the Great Master

The Challenge: Can We Bring a Master Artist Back to Life?

Rembrandt Van Rijn (1606-1669) was one of the greatest visual artists ever, and certainly the most important Dutch artist.  His empathy for the human condition set him apart – his work focused predominantly on portraiture and the spiritual, and compared to previous artists, he was unmatched in his ability to capture his subjects’ emotions through subtle facial cues.

Dutch bank ING had a simple but powerful question – can the great master be brought back to life, to create a new painting?  Enlisting partners such as Microsoft and TU Delft, ING funded a team of machine learning scientists, software engineers, and art historians to attempt the impossible.

A Masterpiece is Born: The Next Rembrandt Conceived and Executed

The team began with a huge set of raw data – 150GB of 346 Rembrandt paintings. Their first pass was with a deep-learning algorithm to upscale some of the images, maximizing resolution and quality.  Next, they used a separate algorithm to determine Rembrandt’s most common subjects, partitioned by factors such as age, gender, and even head-facing direction.  Using that analysis, the researchers determined that the final painting should be a portrait of a Caucasian male with facial hair, 30-40 years old, wearing black clothes with a white collar and a hat, facing to the right.

To construct the painting itself, the team first used its training set of paintings to construct new facial features – a representative pair of eyes, a nose, a mouth, etc.  Using a facial recognition algorithm, the team then determined the usual proportionality of these features in Rembrandt’s other subjects, allowing the individual constructed elements to be placed in relation to one another on the face.  In this step, the researchers also rendered light and shadow, since this “spotlight effect” was a principle element of Rembrandt’s work. In addition to the feature engineering that dominated the efforts described above, the researchers moved beyond the 2D plane.  In order to capture Rembrandt’s textures and brushstrokes, the team analyzed a handful of Rembrandt paintings with a 3D scanner, to construct a highly detailed height map of the paintings. Using a 3D-printer, the researchers were able to print the final painting with 13 layers of ink, one on top of the other, utilizing the height map to determine texture and the previous 2D models to determine form.

The Next Rembrandt

Looking to the Future: Modifications and Commercial Applications

While popular press generally received the painting positively (it won a few advertising awards), focusing on the technological aspects of its creation, reactions overall (especially from experts) were mixed.  Some claimed that the features and colors are all wrong, while other critics saw it as an opportunity to learn new things about an artist who has been otherwise so closely studied by traditional methods.  Still others were disconcerted about what the advancement might mean for humanity’s place in creating art. We see the project as a great opportunity for people to engage more deeply with machines to create masterpieces.

Although the technological piece used only existing algorithms and approaches, the project had clear value in combining them in a unique way to do something that had never even been tried before – produce a brand new painting representative of an existing artist using only (or primarily) machines.  As such, we are confident of the approach’s commercial value, especially to museums that are interested in the intersection of technology and art.  One can easily imagine a successful tour of a handful of such paintings, with additional works representative of other masters – Picasso, Monet, O’Keefe, etc.  Or museums and art historians might use the technology to better explore and understand artists, getting a sense for those characteristics and details that span across a collection. These sorts of paintings could also be sold to less wealthy collectors – having a “Rembrandt” in your home might be a fascinating way to show an appreciation of the arts at a fraction of the cost.

Nonetheless, we believe the approach can be pushed in a number of directions.  In a coarse sense, we would want to see additional features, and more creativity over translation.  Our principle concerns though stem from the enormous manpower still involved – 18 months for the creation of this painting.  The more automation, and the less handcrafted aspects of the process, the more feasible the technology on a commercial scale and application to multiple artists.  Finally, it remains unclear the degree to which such a process could produce multiple unique works from the same artist inputs, an undoubtedly central question. Many of these changes try to address one the main critiques of this project – that it was more a human-chosen average painting upgraded by machines instead of a true computer-generated Rembrandt.

Sources:

  1. https://www.nextrembrandt.com/
  2. https://news.microsoft.com/europe/features/next-rembrandt/
  3. http://www.adweek.com/brand-marketing/inside-next-rembrandt-how-jwt-got-computer-paint-old-master-172257/
  4. https://www.jwt.com/en/amsterdam/work/thenextrembrandt/
  5. https://www.engadget.com/2016/04/06/the-next-rembrandt-3d-printed-painting/
  6. http://www.adweek.com/brand-marketing/jwts-next-rembrandt-wins-two-grand-prix-cannes-cyber-and-creative-data-172171/
  7. http://www.thedrum.com/news/2016/06/24/verdict-why-next-rembrandt-sets-new-standards-creative-data


SmartRank – Using SmartData to fight poverty (The Computers)

The problem

As Shopaholics, aspiring MBA entrepreneurs or just fortunate citizens of the developed world, we take access to funds and capital as granted. We also understand that our financial behavior and habits are gathered, tracked and analyzed to price our cost of capital. If I will not pay my credit card in full, the next time I’ll need a loan, I will pay more. FICO score has become a dating filtering tool, a question on a job interview or just a social comparison mechanism.

But for more than 1B people around the globe, FICO score is myth. These individuals, concreted in developing countries, do not have access to any formal methodology of credit scoring. This is a growing problem in emerging markets, with emphasis on entrepreneurs and small business owners, where access to finance is a key factor in their financial survival and development. Micro-finance and lending, led by Muhammad Yunus and Grameen Bank, improved dramatically the access to funds in the developing world, but at a price. Micro lending risk premiums are high, with some annual rates rise as high as 100 percent, mainly attributed to the lack of ability to measure risk. At a typical microfinance bank, accessing a loan is often prohibitive due to challenges in measuring risk and approving capital, processes that take time and cost money.

For example, at Microfinancer institute in Uganda, in order to access an asset financing loan equires 25 pages of paper work, multiple branch signatories (who need government ids), guarantors, site visits to the client home and branch, photos of assets to be used as collateral, and takes a minimum of 4 weeks to process. a borrower taking out a 200,000 UGX loan would incur anywhere from 15,000 -20,000 UGX in extra costs to print collateral photos, and pay for the credit officers transport to his or her’s business and home.

The Solution

Increased access and usage of cell phones and the internet has provided a new

set of data inputs to evaluate customer, especially in central and eastern Africa with prevalence of mobile money and usage of social networks.

SmartRank will implement a new algorithm utilizing data inputs based on mobile usage and internet activity to provide credit scores almost instantly for BoP clients, lowering costs for both the client and the bank. Apart from lowering cost of issuing, SmartRank will also enable better risk management which will reduce the average risk premium on current micro-lending interest rates.

Apart from collecting data on mobile usage (# calls, bill payments, mobile money usage, length of calls, types of numbers, engagement with official authorities, etc.) SmartRank will use social media inputs (use of language, spelling, activity, likes, # of friends, etc), GPS data, healthcare information and other public records to provide a comprehensive financial risk analysis of borrowers. All the data would be anonymized and the company will implement the highest standards of privacy and security.

Some solutions, such as First-Access and ScoreLogice, provide partial analysis based on similar data inputs, but none of the existing solutions provide such a robust and comprehensive analysis, focused on emerging markets.


The Pilot

SmartRank will use past data from micro-lenders to demonstrate its ability to predict risk, compering the projected default rates to actual data. This will also be used to enrich the algorithm and improve accuracy. Initial tests with public data form the Lending Club found very interesting correlations –  people with less than 300 FB friends and receive less than 2 SMS messages per day were 15% more likely to default. Individuals who do not use capital letters in their application are 7% more likely to default and applicants who write“thank you” in their forms where 23% more likely to repay earlier than the deadline. A trial run on past data showed 28% improvement in risk analysis, which could be translated to a 25% reduction in average interest rates.

Access to live data would truly promote and advance small ventures in the developing world and would demonstrate to the financial industry that FICO scoring belongs to the past. SmartRank is the future.

Sources –

https://letstalkpayments.com/alternative-credit-scoring-us-data-science-financial-potential-thin-file/

http://www.nytimes.com/2010/04/14/world/14microfinance.html?pagewanted=all

http://www.businessinsider.com/hundreds-of-suicides-in-india-linked-to-microfinance-organizations-2012-2

http://www.cgap.org/sites/default/files/Forum-Microcredit%20Interest%20Rates%20and%20Their%20Determinants-June-2013.pdf


HoloWorld – your space will never be the same (The Terminators)

In our advanced world today, although we can call an Uber and order food by simply saying “Alexa,” it is still a pain to shop for your home. Furniture options are scattered among multiple merchants and vary significantly by size and style. In most cases, you want to see the furniture with your own eyes to better understand the size and fit in the room, but this would mean traveling miles and dragging yourself to multiple locations. Oftentimes, only select SKUs are presented in-store (particularly due to size), or the specific color you like is missing. Even after you’ve found your perfect sofa it might fail to fit your living room due to incorrect measurements, or finding out that it just is not the right fit for your space. Some experts have already tried to tackle this pain point by inventing virtual reality tools like lenses or computer mock-ups to help customers imagine their future spaces. All existing solutions only allow the customer to use dimensions, and usually on a two-dimensional basis. Today, there is currently no 360-view solution to help customers optimize this complicated decision.

We are proud to introduce HoloWorld: a 360-camera & projector that operates as an add-on attachment to your mobile phone, allowing you to design your space hassle free through holographic visualization. HoloWorld will start by scanning the room and identifying current objects using AI. Then, it will recommend potential furniture pieces that the customer might like using deep learning algorithms, allowing him to project a 3D holographic representation of the furniture piece directly into the space using our special, patent-pending projection device. Through the accompanying mobile app, users will be able to purchase furniture directly from the platform. Over time, the HoloWorld will learn from users’ tastes and improve its AI system & recommendations. This innovative device borrows capabilities from existing technologies, including the sensor and AR technologies behind Snapchat, Microsoft’s Hololens, and other AR devices.

The business potential of HoloWorld is huge. For B2C customers, it will allow them to experience what the space looks like with their desired pieces of furniture projected directly into the space. For B2B customers like furniture outlets and interior designers, it will allow them to turn every consumer’s apartment into a showroom and get their newest designs into consumers’ apartments in an instant, making the selling process that much easier. The US furniture market and the e-commerce furniture market were $137B and $29B respectively in 2017. These numbers are expected to continue growing, especially in the e-commerce space. This implies up to $2.9B in revenues, with HoloWorld earning 10% affiliate fees on all furniture sales through its B2B channel.

The main competitors in the virtual furniture market are Wayfair Virtual Reality and Microsoft HoloLens. These two main competitors offer different products than HoloWorld, but will be able to compete directly for the addressable market.

Furniture holograms by HoloWorld are just the beginning. With additional R&D, we will be able to extend the core technology to countless applications, from projecting proposed buildings onto a construction site, to projecting a 3D piece of clothing onto a shopper, to even broadcasting 3D people — the possibilities are endless. Additional partnerships with Amazon Echo, Google Home, the iPhone, smart TVs, and more will open a whole new set of opportunities that will enhance the customer experience and will surely set HoloWorld on the trajectory towards complete world domination.

Pacemaker Predictive Analytics (Pitch)

Team: Shallow Blue

Our solution predicts when someone with a pacemaker is about to experience cardiac arrest, so that a physician can appropriately intervene ahead of time and save the patient from the discomfort of receiving a shock from the pacemaker.

Background on the Problem

The global pacemaker market is expected to reach $12.3 billion by 2025[1], and each year 1 million pacemakers are implanted worldwide[2]. A pacemaker is a small, battery-operated device that is usually placed in the chest to treat arrhythmias, or abnormal heart rhythms. It uses low-energy, electrical pulses to prompt the heart to beat at a normal rate. A similar device called Implantable cardioverter defibrillators (ICDs) can prevent sudden cardiac arrest. There are also new-generation devices that combine both functions.

Pacemaker

Although pacemakers and ICDs can deliver lifesaving therapy, they are not always accurate; up to one-third of patients get shocked even when they shouldn’t be. This potentially leads to adverse health outcomes, as some trials suggest a strong association between shocks and increased immortality in ICD recipients[3]. Thus, there is a real patient need for a solution that identifies and prevents cardiac arrest even before it happens. Identifying patients at risk can prevent shocks, hospitalizations, and even death, and can also generate quantifiable cost savings: a Stanford study suggests $210 million in Medicare savings could be achieved by introducing this type of technology[4].

Description of the Solution

We propose the development of an analytics dashboard for physicians that uses machine-learning algorithms in combination with remote monitoring data collected from the patient’s pacemaker to identify a patient’s risk for cardiac arrest. The algorithm will employ supervised learning as it will initially be trained on de-identified data from patients who have been correctly shocked in the past. This data will be collected from remote monitoring systems, which collect hundreds of data points each and every minute spanning across 60+ variables such as heart rate, activity level, fluid backup, and variability in EKG findings. We found that a number of these variables change in the hours and days leading up to a shock; see the figure below for what a life-threatening cardiac arrest looks like for a device right before it delivers therapy.

Moments leading up to a shock on a device

Our dashboard would essentially build a layer of analytics on top of the existing ICD logic that will improve the accuracy of the shocks and alert physicians when certain changes in variables might indicate that a patient is at risk of cardiac arrest. The model will be based on neural networks combined with a support vector model that can relate patients in real time with those that have received a shock in the past. See the figure below for an example dashboard interface, with the tile in the bottom left corner alerting the physician to the patient’s risk level.

Sample dashboard interface

Empirical Demonstration

We will design a prospective randomized control trial that will randomize patients into either a control group or a treatment group. Each patient will be assigned a risk score by our algorithm. The control group will continue to use their pacemaker/ICD as is, while the treatment group will receive additional preventative warnings generated by our algorithm that will alert them to seek immediate help from a physician. We will measure and compare 1) the total number of shocks delivered; 2) the proportion of shocks that are inaccurately delivered; and 3) the number of “interventions” from our algorithm that resulted from a real, elevated measure of patient risk, as ascertained by the physician. A successful outcome for this demonstration would be an overall reduction in the total number of shocks on a risk-adjusted basis (measure 1), a reduction in the “false negative” rate (measure 2), and a low overall “false positive” rate (as extrapolated from measure 3).

Pilot

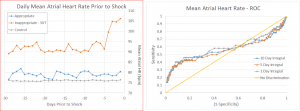
We conducted a pilot study of over 2,500 patients and found that several key variables change prior to shock. The graph on the left shows the elevation in heart rate prior to shock. The graph on the right shows the predictive value of this variable in a univariate regression analysis. As you can see, heart rate on its own already seems to be a fairly good predictor of a shock. We then ran a logistic regression on all 60+ variables to identify multivariate correlations. See the figure below for the results of that model.

Univariate regression analysis (using heart rate)

Multiple regression analysis

[1] Grand View Research, December 2016: http://www.grandviewresearch.com/press-release/global-pacemaker-market

[2] Mond, H. G. and Proclemer, A. (2011), The 11th World Survey of Cardiac Pacing and Implantable Cardioverter-Defibrillators: Calendar Year 2009–A World Society of Arrhythmia’s Project. Pacing and Clinical Electrophysiology, 34: 1013–1027.

[3] Schukro, C. (2014) Implantable Cardioverter-Defibrillators Shock Paradox. e-Journal ESC Council of Cardiology. Vol. 13, No. 9, 16 Dec 2014.  https://www.escardio.org/Journals/E-Journal-of-Cardiology-Practice/Volume-13/Implantable-cardioverter-defibrillators-shock-paradox

[4] Medscape. “New Pacemakers, ICDs With Home Monitoring Save Time.” http://www.medscape.org/viewarticle/433442