Introducing Poppins, the Intelligent Parenting Assistant

Poppins, the smart baby monitor that predicts why your baby is crying, is here to help guide new parents through the labyrinth of raising a child. We are requesting $200,000 to develop the initial prototype and fund a study to prove the effectiveness of the device on raising healthy children and assuaging parental fears.

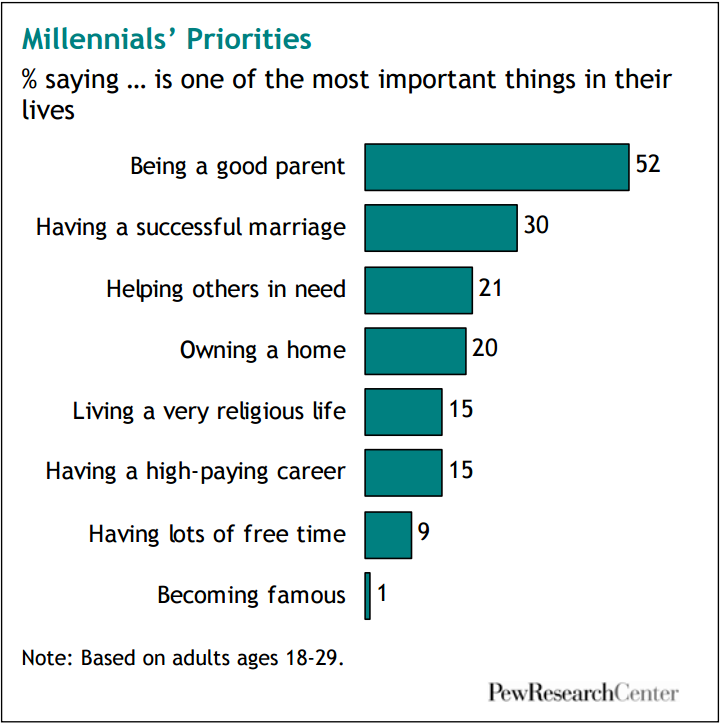
Millenials worried about parenting

There’s nothing more important to people in this world than their babies. A Pew Research study found, about half (52%) of Millennials say being a good parent is one of the most important things to them compared to 42% of Gen-Xers at a comparable age.

Yet, children don’t come with an instruction manual. And, as every new parent learns, it can be a terrifying job—with the feedback erring on the negative side: your child will scream and cry for hours.  On average, newborns cry for about two hours each day. Between birth and about 6 weeks of age, this typically increases to almost three hours each day! How do we help parents, in real-time, know what to do when their baby cries? Even further, how do we limit the many frustrations and anxieties that stem from being unsure about what to do? Existing baby monitor technology fails to provide an intelligent guidance solution for why your baby is crying. They can only alert you, show you images of your child, and provide biometric information. What if we could do more with data to provide real-time recommendations for parents in their time of need? The baby monitor market is expected to grow between 8.5 – 11% over the next 5-7 years and reach $1.4 billion over that time. This growth is primarily driven by changing habits in households with two employed parents who want to stay remotely connected to their baby combined with increased awareness of baby safety issues and online retailing. Innovation in this space has led to a generation of high-priced, smart baby monitors with features such as infrared night light, in-built lullabies, and temperature sensors. Our solution goes beyond monitoring and into predicting the right action to help your child. Introducing Poppins, an intelligent parenting assistant that helps parents determine the best course of action when their baby cries.

Poppins is here to guide new parents

Faster than you can say “Supercalifragilisticexpialidocious” Poppins is here to help you be your best parent. Worried about waking up to the sound of your child crying and not knowing what to do? Does that specific cry mean it’s hungry, lonely, or even in danger? Using a prediction model built with childcare experts and your child’s past behavior, Poppins will use the pitch of the cry, the time of night, the baby’s age, motion sensor technology, and other inputs to predict a range of reasons for the crying, as well as recommend steps to help get your child back to sleep. Based on research and expert commentary, Table 1 catalogues prevalent factors that may drive your baby to tears.

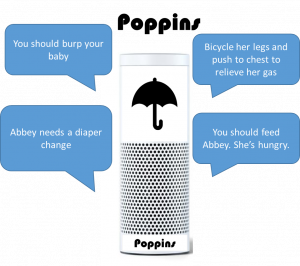
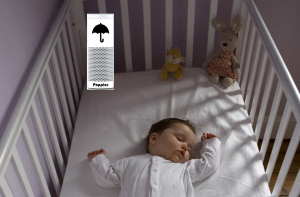
It also includes critical variables and measurements that can inform prediction and what a recommendation may look like. With additional data over time, we hope to deepen the public’s understanding of factors that result in upset babies and vastly improve the prediction process, which will initially be trained on research. Rather than waking up in a panic, wake up with a plan and know which spoonful of sugar will help your baby go down. In addition to translating your baby’s language, Poppins can track their sleeping patterns to predict what bedtime ritual works to help them sleep through the night. Poppins is a baby monitor that does more than just monitor the problem.

Growing up with Poppins

As your child grows, rather then flying away on an umbrella, Poppins features expand to keep up with your child. Poppins will chart your child’s word development, so you can see its first words, how its word complexity develops, and what curse words it is picking up.  It can also compare your child’s development to national averages, and recommend steps to improve your baby’s language skills. When it comes to discipline, Poppins can try to predict why your child may be acting out, as well as ensuring you are consistent so the child is learning from its behavior, and ensuring you don’t use no too much so when you do, “No” really means something. Poppins can help you raise your child in the most delightful

Image result for baby language over time graph Vocabulary Development

Poppins “Freemium”Model

We plan to monetize Poppins through two channels.  First, we will earn revenue and profit off of sales of the Poppins Smart Baby Monitor Unit. In order to optimize for network effects and improve the performance of our recommendation engine with more data, wide adoption is critical. Accordingly, the unit price of $49.99 will be at the very low-end of the spectrum for smart baby monitors, which retail at up to $2507. This purchase will come with access to a free Basic subscription to the Poppins application for iPhone and Android. Consumers will be able to use the monitor to see and hear their infant, and have access to their own historical data on metrics like number of times the baby woke up per night, the duration of crying, and a score of how restless they were. However, in order to access more advanced features, consumers will have the option to purchase a monthly Premium prescription of $9.99.  The Premium version of the product will perform the in depth analysis of the infant’s crying patterns, tonality, movements, and more, and provide recommendations based on our advanced algorithm.  Given that the Poppins algorithm will improve the more customers and the more data we have to train, exhibiting strong network effects, we believe this “freemium” model is ideal.  We will create a huge amount of value by learning from the large base of Basic Poppins subscribers, and monetize that value by selling advanced features to those who value them the most while still collecting data and improving our engine through non-premium subscribers.

Poppins cares about privacy

We will guarantee our customers that Poppins will never utilize ads, and that we will never sell their data to outside parties.  Though this monetization stream could potentially be lucrative, we think that it is not worth privacy concerns and loss of customer trust. Given the highly sensitive nature of the product, which deals with small children, privacy is a huge potential concern.  By providing an upfront No Advertisement guarantee, we believe that we can help assuage those concerns. Also, generally speaking, baby monitors are already accepted listening devices within homes showing that parents are willing to sacrifice a little privacy for the sake of their child’s safety and comfort.

Poppins Pilot

A convincing Poppins pilot will demonstrate value across two critical dimensions. First, how does our solution impact outcomes for the baby? Second, to what extent do parents feel better equipped to provide appropriate and effective care. We propose a large study (~100 babies and their parents) where one half is treated as a control group and the other half uses a fully functional Poppins Baby Monitor. The control group will also be given the Poppins Baby Monitor but without a working recommendation engine, mimicking the functionality of a standard baby monitor found in the market. After a period of 2 months, we expect to generate a scorecard of critical results – an example can be found in Table 2 below. These results will partially be populated by data collected from the Poppins instruments and partially populated by participating parents on their experiences. We expect to drive positive outcomes as it relates to feelings of anxiety, preparedness, and confidence engaging in child care.

Table 1 – Core Diagnoses, Data Collection, and Recommendations

Reasons Your Baby Is Crying Predictors Solution
Hunger Lip-smacking, sucking on hands, time since last meal Feed the baby
Temperature Ambient temperature Add or remove clothing

Move the blanket

Change the temperature

Nappy change Last meal, last diaper change Change the diaper
Stomach problem, burping, gassy Wriggling, arching back, pumping legs or recently sucked pacifier, hiccupped, cried Bicycle legs and push to chest to relieve gas
Teething Age (4 months old), excess drool, gnawing on objects Pacifier

Massage gums

More stimulation Time since last interaction Automatically plays lullaby
Less stimulation Unfamiliar surroundings, ambient noise, ambient light One-on-one interaction with a trusted loved one
Just need to cry Love, physical comfort Swaddle

It’s okay to let your baby cry


Table 2 – Pilot Scorecard

Pilot Scorecard Control Group Poppins
Populated by Poppins data collection
How often did your baby cry? xxx xxx
How much time did your baby spend crying? xxx xxx – 10% (target)
On average, how long did a parent spend with their crying child xxx xxx – 10% (target)
Survey populated by parent participants

As a parent, rate the following based on how well they describe your experience from 1-10

When my baby cries, I feel confused and stressed xxx xxx – 10% (target)
When my baby cries, I do not know how to respond xxx xxx – 25% (target)
When my baby cries, I feel like my actions address their needs xxx xxx + 25% (target)
When my baby cries, I feel like only my partner is equipped to provide care xxx xxx – 50% (target)

Sources:

1  http://www.pewresearch.org/fact-tank/2010/03/24/parenting-a-priority/

2  https://www.babycenter.com/404_why-does-my-baby-cry-so-much_9942.bc

3  http://www.researchandmarkets.com/reports/3641386/world-baby-monitor-market-opportunities- and

4 http://www.reportsnreports.com/reports/857411-global-baby-monitors-market-2017-2021.html

5 https://www.alliedmarketresearch.com/baby-monitor-market

6 https://www.babycentre.co.uk/a536698/seven-reasons-babies-cry-and-how-to-soothe-them

7 https://www.safety.com/blog/best-smart-nursery-products-and-baby-monitors/


Anecdotal Evidence – SMaRT Pantry: Simple Meals and Recipes Tonight

SMaRT Pantry Makes It Easier to Cook at Home

More and more individuals are looking for solutions to make healthy, home cooked meals easier and cheaper. This growing market—as evidenced by companies like Blue Apron, a recent startup expected to have more than $1 billion in revenue this year [i]—targets those people who shy away from the inconvenience of cooking at home. When asked why they don’t cook, people’s answers range from not having the right ingredients to not being able to cook to not having the time to look for something quick and easy. SMaRT Pantry addresses each of these issues by providing users with recommended recipes that fit their cooking level while using ingredients already on hand.


Machine Learning Techniques Identify Recipes that Fit You

The Simple Meals and Recipes Tonight (SMaRT) Pantry uses machine-learning techniques to provide consumers with access to recipes that meet their flavor, cooking level, and time preferences while strategically choosing ingredients they already have in their refrigerator or pantry. By taking user preferences, data from similar users, and pantry contents, SMaRT Pantry generates customized dinner solutions – it’s like having a personal chef hand-pick every night’s dinner menu.

How it Works

Step 1: Pantry contents (as provided by store receipts or manually entered), favorite recipes, food allergies and dislikes, total cook-time preferences, health and budget desires, and preferred difficulty level are uploaded into the SMaRT Pantry app.

Step 2: SMaRT Pantry uses your historic data (ratings, similar-user preferences, recipe characteristics) and, with state-of-the-art machine learning technology, returns a personalized set of suggested recipes. Depending on your settings, this list may include recipes using only what’s currently found in your pantry, or it may generate a grocery list that allows you to pick up a few key items to execute the perfect recipe.

Step 3: Simply rate your meal to improve future recommendations. With additional use SMaRT Pantry gets better at personalizing recipes for you: providing new ideas and increased meal variety.

The Business of SMaRT Pantry

Initial Development

To prove our concept, we built a beta version of our app. First, we scraped over 10,000 recipes from various online data sources and compiled them into a centralized database. We then simulated user review data to act as a test case for our system—going forward we hope to replace this with actual recipe ratings. Next we built a machine learning algorithm that uses both singular value decomposition and item-based collaborative filtering to predict what a user will rate a given recipe based on their historic review pattern. The goal of these methods is to balance characteristics of recipes (e.g. recipes that are well reviewed in general) with user-specific preferences (e.g. finding similar consumers and using their ratings) to generate a predicted recipe rating. To better test this algorithm, we would need to gather real review data, either by launching our app or partnering with a recipe review platform like allrecipes.com.

Figure 2 shows our beta version of the app, which takes recipes from our database and matches them to users based on a user’s historic ratings. It then combines those predicted ratings with specific meal preferences and outputs a list of potential recipes for tonight.

Phase 1 (Present – 1 Year)

In Phase 1 we will grow a user base to cook and rate SMaRT Pantry’s recommended recipes. Users will benefit from time savings as they will no longer need to scour websites trying to decide on a meal, and with more use they will see that SMaRT Pantry is better able to predict which meals they will enjoy. When SMaRT Pantry reaches 50,000 reviews, the machine learning algorithm will begin to incorporate other user data into recommendations.

Phase 2 (1 Year – 2 Years)

During Phase 2, we will launch additional, paid features. Users will be able to subscribe to the service and begin tracking pantry inventory. Pantry inventory will be managed by having users scan in store receipts, through manual entry of information, and by the record a SMaRT Pantry recipes made. Besides recommending recipes, SMaRT Pantry will be able to use pantry data to recommend grocery lists based on 1) the frequency of typically-purchased items and 2) recipes that would be recommended with the addition of a few supplemental items. Finally, we would also begin to seek advertising revenue from free users.

Phase 3: Additional Features and Partnerships (2 Years +)

Grocery Delivery: Through a partnership with companies like Instacart, a grocery delivery service, SMaRT Pantry can make getting groceries even easier. Users only need to quickly review SMaRT Pantry’s recommended grocery list and through the click of a button have those items delivered within the hour. We anticipate a partner would be willing to pay us a small percentage of all orders placed through SMaRT Pantry.

Push Notifications: Push notifications will provide users with information on what products have been sitting in the pantry for a while and likely need to be used up before reaching their expiration dates. These will also be incorporated into recommended recipes if users note as a preference.

Integration with Other Technology: SMaRT Pantry could even be expanded to incorporate other augmented perception technology. Smart fridges, RFID tags, or other sensors could automatically identify pantry contents, or internet of things appliances could assist in recipe execution, perhaps by preheating the oven or starting a slow cooker in the morning.

Business Model and Funding Ask

The biggest hurdle SMaRT Pantry faces in its initial development is the gathering of user and recipe data. As such, we will begin exploring partnerships with online recipe providers to build a collection of recipes. More importantly, though, in order to be able to provide significant value to users, we estimate that our machine learning algorithms would need at least 50,000 recipe reviews. We estimate that the average user would leave 5 reviews and are assuming a user acquisition cost of about $5 [ii], meaning we require $50,000 for marketing to gather the initial 10,000 users. Beyond that hurdle, we would need about $40,000 for further app development and database hosting.

Once we have our initial set of data and users, we would focus on various avenues of revenue generation: advertising, paid subscriptions, and partnerships (e.g. Instacart). Because there are almost no physical costs to SMaRT Pantry, revenue generated through these methods would go straight to the bottom line, allowing SMaRT Pantry to fund its own continued development. The market for easier, simpler home-cooked meals is huge (larger than $1.5 billion annually [iii]), and SMaRT Pantry can capture a piece of that market at extremely low costs.


Technology vs. Human: SMaRT Pantry Has Us Beat

To demonstrate the effectiveness of SMaRT Pantry to a broader audience (between Phases 2 and 3), we propose a cooking challenge in which the target consumer provides information on her favorite recipes, allergies, and preferences to a professional personal chef. This chef, using a typical pantry, picks a recipe and prepares a meal for her. SMaRT Pantry takes the same information as the chef and, using its database of other users and user preferences, selects a recipe. A second professional chef will prepare this meal. The outcome? Our target customer tastes both meals and sees that SMaRT pantry is better able to predict what she likes. In other words, SMaRT Pantry is better than a personal chef picking your menu every night! The bonus, of course, is that she can use SMaRT Pantry herself and pick a recipe in a fraction of the time that it would usually take.

We could pilot this demonstration either directly for potential partners (showing them the value of this product) or to random potential customers. We could then use those results in advertising, showing testimonials where new users rave about how much the SMaRT Pantry understands their preferences. Our marketing could then be based around the idea of “having a personal chef pick your menu every night.” This gets to the core technology of the system—the data-based approach to choosing a meal that fits every individual’s needs and wants.


Sources

[i] https://www.recode.net/2016/10/2/13135112/blue-apron-revenue-run-rate-billion-ipo

[ii] https://fiksu.com/resources/mobile-cost-indexes/

[iii] https://www.eater.com/2016/5/20/11691446/meal-delivery-blue-apron-plated-hello-fresh-marley-spoon

Final pitch sumbission: Engauge (Teamwork makes the dreamwork)

Problem:

Engauge is a product suite that provides real time feedback on engagement in order to optimize messaging for the target audience. Initially, Engauge will be focused on the education sector with broader future applications in areas such as live entertainment, television, and movies. Studies have shown that students with teachers that “make them feel excited about the future” and a school that “is committed to building the strengths of each student” are 30 times more likely to show engagement in the classroom than students who do not agreement with these statements. (source: http://www.edweek.org/ew/articles/2014/04/09/28gallup.h33.html). According to a report by Gallup education, engagement in the classroom is the key predictor of academic success. Students often have short attention spans and keeping them consistently engaged is a challenging endeavor. Unfortunately, current solutions that measure engagement rely on surveys and student feedback which are not done in real time and can often be extremely inaccurate. The Engauge solution will not only provide more accurate feedback that doesn’t rely on subjective measures, but will also provide this data in real time to teachers. This will allow teachers to adjust on the fly when engagement is slipping in order to ensure that students remain consistently engaged. Engauge will accomplish this by utilizing advanced real-time image and sound processing technology on an individual level.


The education sector represents a huge opportunity as represented by the massive scale of private schools within the US. Private school revenue totals $56.7 billion and it is estimated that 5.4 million students attend close to 34,000 private schools with average annual tuition of $13,640 ($22,440 excluding non-sectarian schools). Private schools are continually innovating to attract parents who are willing to pay a large annual fee so that their children can receive a superior education. Engauge will provide private schools with a significant advantage as they will be able to utilize the solution to maximize engagement and utilize analytics to continually improve their teaching methods and subject matter.


Solution:

Engauge will utilize advanced real-time image and sound processing technology to measure audience engagement in a variety of contexts. Our initial focus will be on the education sector. Some of the classroom use cases we are most excited about include:

  • Diagnostic tool to understand key gaps in material and delivery
  • Student-specific trend analysis to identify at-risk students early on
  • Course-correct in real-time as students start to lose interest
  • Individualized career counseling based on material that most piques each student’s interest


The technology that allows us to deliver these powerful insights is driven by a Convolutional Neural Network for both image recognition and natural language processing. The CNN model will collect a number of key inputs into our model:

  1. Image:
    1. Identity of student
    2. Facial expression
    3. Eye focus (i.e. where they are looking)
    4. Body posture
    5. Body movements (e.g. fidgeting)
  2. Audio:
    1. Tone
    2. Emphasis
    3. Topic / content
    4. Lesson type


By pairing the visual data with the audio data, we can deliver powerful insights on how students are engaging with a teacher’s material. The set-up is extremely simple – all that is required is to set up our plug-and-play video camera at the front of your class. Engauge will be a completely SaaS platform, so the feed from the camera will automatically be sent through our algorithms and the output and analysis will be communicated in real-time.


More detail on CNN:

There are 4 main operations in the CNN:

    1. Convolution: Extract features from the image


  • Non-linearity: Real-world data is non-linear, so model include those elements
  • Pooling: Make input representations smaller and more manageable
  • Classification: Classify different components of an image


Pilot plan:

To apply and demonstrate this new technology, Engauge will initially target K-12 private schools. We believe private schools are the best initial target for Engauge, given how critical student engagement is to academic success. Private schools in particular have the resources to implement the technology and interpret results. They will also be more open to adjusting teaching methods to improve overall engagement levels. Once adopted, we believe parents will be interested in the information as well, and will use this data as a way of comparing potential schools in which to enroll their children.

We intend to pilot Engauge at The University of Chicago Lab School. This school in particular is a perfect playground to launch Engauge, as teachers and parents alike are interested in new technology and will be eager to analyze new data. Engauge monitors will be randomly placed in 50% of Lab School classrooms. Teachers and students will not know which classrooms have Engauge technology installed. For one week, teachers will be asked to fill out a brief survey after each class that assess student engagement. Survey questions will include:

  • What topic was discussed in today’s class?
  • In chronological order, what activities occurred (lecture, discussion, etc.)?
  • On a scale of 1 to 5, how engaged were students in today’s class?
  • What part of class did students find most compelling (and what time did this occur)?
  • What part of class did students find least compelling (and what time did this occur)?


Over the pilot week, we will aggregate data from each grade and compare survey results to Engauge metrics. We believe Engauge will be able to more accurately pinpoint levels of engagement in each class and throughout the school day. Data will reveal which teaching methods worked in keeping students engaged in the subject, and which methods were not as well received. It will also show which teachers have overall higher and lower engagement levels, and also identify specific children that have downward trending engagement.

We believe that overtime, Engauge will be a predictor of test scores and student satisfaction levels. Teachers will be able to improve their teaching methods, as well as experiment with new ways to keep students excited. Principals will be able to use Engauge data in aggregate to assess how well the school is doing as a whole. They will be able to assess which teachers are engaging their students best, and which subjects generate more student excitement. This technology provides a way of assessing new hires and monitor teachers that may be struggling. It will also allow schools to identify at-risk students that are losing interest earlier, and help them get back on the right track with tailored help based on engagement data.


Overall, Engauge will equip private schools with better information on how their teachers and students are performing. This technology will promote student participation, which has been shown to lead to better test scores and graduation rates. As Engauge’s algorithm strengthens which each class, we will be able to adapt the technology in other for-profit sectors, as well as public schools that will benefit even more from this data.


Funding ask:

We are asking for $90k to fund this pilot with the University of Chicago Lab School. Our technology is already built and ready to be tested in a classroom setting. We believe this pilot will give us the data and insights to launch Engauge to the next level.

Shallow Blue: Pacemaker Predictive Analytics

Our solution predicts when someone with a pacemaker/ICD is about to experience cardiac arrest, so that a physician can appropriately intervene ahead of time and save the patient from the discomfort and harm of receiving a shock from the pacemaker. We are requesting $250,000 to help fund the upfront clinical trial and proof of concept phase, at which point we will need additional funding to commercialize and scale the product.


Background on the Problem

The global pacemaker market is expected to reach $12.3 billion by 2025, and each year 1 million pacemakers are implanted worldwide. A pacemaker is a small, battery-operated device that is usually placed in the chest to treat arrhythmias, or abnormal heart rhythms. It uses low-energy, electrical pulses to prompt the heart to beat at a normal rate. A similar device called Implantable cardioverter defibrillators (ICDs) can prevent sudden cardiac arrest. There are also new-generation devices that combine both functions.

Pacemaker


Although pacemakers and ICDs can deliver lifesaving therapy, they are not always accurate; up to one-third of patients get shocked even when they should not be. This potentially leads to adverse health outcomes, as some trials suggest a strong association between shocks and increased mortality in ICD recipients. Thus, there is a real patient need for a solution that identifies and prevents cardiac arrest even before it happens. Identifying patients at risk can prevent shocks, hospitalizations, and even death, and can also generate quantifiable cost savings: a Stanford study suggests $210 million in Medicare savings could be achieved by introducing this type of technology.


Description of the Solution

We propose the development of an analytics dashboard for physicians that uses machine-learning algorithms in combination with remote monitoring data collected from the patient’s pacemaker to identify a patient’s risk for cardiac arrest. The algorithm will employ supervised learning as it will initially be trained on de-identified data from patients who have been correctly shocked in the past. This data is already being collected from remote monitoring systems, which collect hundreds of data points each and every minute spanning across 60+ physiologic variables such as heart rate, activity level, fluid backup, and variability in EKG findings. Through an initial pilot study, we found that a number of these variables change in the hours and days leading up to a shock; see the figure below for what a life-threatening cardiac arrest looks like for a device right before it delivers therapy.

What the moments leading up to a shock look like on a device

Our dashboard would essentially build a layer of analytics on top of the existing ICD logic that will improve the accuracy of the shocks and alert physicians and care teams when certain changes in variables might indicate that a patient is at risk of cardiac arrest. The model will be based on neural networks combined with a support vector model that can relate patients in real time with those that have received a shock in the past. See the figure below for an example dashboard interface, with the tile in the bottom left corner alerting the physician to the patient’s risk level.

Sample dashboard interface

Once a patient has been identified to be at risk for impending shock by our dashboard, the care team can provide preventative care. This can include a) medical management (diuresis, antiarrhythmic medications, or hemodynamic monitoring) to prevent further clinical decompensation into cardiac arrest requiring device therapy or b) reprogram the device parameters to prevent inappropriate therapy. Through this “human-in-the-loop” intervention, the algorithm can learn to better risk-stratify patients in need of therapy.

For the second version of our product, we will directly integrate our solution into the medical device itself. By doing so, our solution can provide real-time analysis rather than waiting for home-monitoring data transmission. This vertical integration will be first-in-class and provide an advantage over potential new-entrants who seek to develop a cloud-based solution modeled after our initial solution.

We plan to license our software to medical providers so that they can provide higher-quality care to patients with pacemaker/ICD devices. With a changing reimbursement environment that links financial reimbursement with medical outcomes, we believe that physicians and hospitals will be incentivized to pay an ongoing premium to use the software.


Empirical Demonstration

We will design a prospective randomized control trial that will randomize patients into either a control group or a treatment group. Each patient will be assigned a risk score by our algorithm. The control group will continue to use their pacemaker/ICD as is, while the treatment group will receive additional preventative warnings generated by our algorithm that will alert them to seek immediate help from a physician. We will measure and compare 1) the total number of shocks delivered; 2) the proportion of shocks that are inaccurately delivered; and 3) the number of “interventions” from our algorithm that resulted from a real, elevated measure of patient risk, as ascertained by the physician. A successful outcome for this demonstration would be an overall reduction in the total number of shocks on a risk-adjusted basis (measure 1), a reduction in the “false negative” rate (measure 2), and a low overall “false positive” rate (as extrapolated from measure 3).


Pilot

We conducted a pilot study of over 2,500 patients and found that several key variables change prior to shock. The first graph below shows the elevation in heart rate prior to shock. The second graph on shows the predictive value of this variable in a univariate regression analysis. As you can see, heart rate on its own already seems to be a fairly good predictor of a shock. We then ran a logistic regression on all 60+ variables to identify multivariate correlations. See the figure below for the results of that model.

Univariate regression analysis (using heart rate)

We plan to expand our algorithm development beyond this initial feasibility study to include analytical methods borrowing from techniques such as “data-smashing” and “hawkes processes” that provide advanced insight into continuously acquired quantitative data streams. The advantages to these methods is that they can infer causal dependence between streams with a relatively small dataset (as compared to a neural network, for example). Beyond the statistical advantages these methods convey, the relatively minimal computational power required provides an added advantage of being incorporated into the pacemaker itself.

Multiple regression analysis

After finalizing the first version of the algorithm, we will partner with the University of Chicago Medical Center to launch a pilot prospective research study for patients with pacemakers who receive care at the University. Our algorithm and dashboard will be embedded into the workflow of the arrhythmia care provided to patients with pacemakers to identify potential corrective therapy before an arrhythmia occurs. Upon demonstrating the success of the product at the University of Chicago, we will move from the pilot phase into the full launch of our licensed software to other tertiary referral academic medical centers. We will also explore joint-development with device manufacturers as they have a strategic interest in improving their product through advanced analytics.

HoloWorld: Furnish in Style (The Terminators Final Pitch)

In our advanced world today, although we can call an Uber and order food by simply saying “Alexa,” it is still a pain to shop for your home. Furniture options are scattered among multiple merchants and vary significantly by size and style. The struggle in furniture shopping begins with the lack of expertise in this area, since the furniture isn’t a frequently shopped category for most people. Therefore, you are looking for more advices and inputs from others. You collect more reviews from other shoppers, professional advices from interior designers, or feedback from your friends and family. Throughout the furniture shopping journey, the biggest hassle is the uncertainty around how selected furniture would actually look in person or in your room. You want to see the furniture with your own eyes to better understand the size and fit in the room, but this would mean traveling miles and dragging yourself to multiple locations. Oftentimes, only select SKUs are displayed in-store (particularly due to size), or the specific color you like is missing. Even after you’ve found your perfect sofa, it might fail to fit your living room due to incorrect measurements, or finding out that it just is not the right fit for your space. Some industry experts have already tried to tackle this pain point by inventing virtual reality tools, like lenses or computer mock-ups, to help customers imagine their future spaces. All existing solutions only allow the customer to use dimensions, and usually on a two-dimensional camera or lense basis. Today, there is currently no 360-view solution to help customers optimize this complicated decision.

We are proud to introduce HoloWorld: a 360-camera & projector that operates as a standalone or add-on attachment to any home assistance devices (i.e. Amazon Echo, Google Home) or mobile phone. It allows hassle-free furniture shopping experience through the latest technologies in image recognition, recommendation, and projection through holographic visualization. You will start your journey with HoloWorld by simply placing it at the spot where you envision the new piece of furniture to sit at. HoloWorld will be able to recognize objects in a room and classify them into categories, such as sofas, dining tables, accent chairs, and decorations, using its camera and image recognition technology. With the help of a 360 camera, it will be able to obtain the dimension of each object and room depth. Having recognized the objects, it can recommend additional items for the room based on the existing decor, color scheme, and space availability. These recommendations will be based on machine learning techniques similar to Amazon’s recommendation engine. The machine learning techniques will optimize the recommendations by leveraging the information about the particular user captured via the camera and her earlier purchase history, as well as about other users sharing similar preferences. Once the user approves any of the recommendations, our product can project a hologram of the object into the room. The hologram will be visualized through our product that emits smoke and lights at the exact spot where the furniture will be placed if purchased. The user will be able to see a 3D holographic representation of the furniture in the home and envision what the room will look like with the purchased furniture. Once our product is connected to any home assistance devices or mobile phones, it can coordinate an online order and purchase of the selected furnitures in just a couple of clicks or by requesting the order from the assistant by voice. Our advanced technologies in image recognition, machine learning based recommendation, and hologram projection paired with the strong B2B platform will simplify and redefine the furniture shopping experience for everyone. As we gain data on consumer preferences and behavior, our training sets will grow and our recommendation and image detection systems will improve.

The business potential of HoloWorld is huge. The US furniture market and the e-commerce furniture market were $137B and $29B respectively in 2017. These numbers are expected to continue growing, especially in the e-commerce space. HoloWorld is expected to capture $2.9B of the market by expanding the adoption of its tool and service by B2C customers and earning 7.5% – 10% affiliate fees on furniture sales completed through its B2B channel. For B2C customers, it will allow them to get recommendation on ideal products for their home and visualize how the desired pieces of furniture looks in their space through holographic projection. B2B customers include third-party furniture manufacturers (i.e. WestElm, IKEA), online retail aggregators (i.e. Amazon or Wayfair) and interior designers. For these B2B customers, HoloWorld will allow them to turn every consumer’s apartment into a showroom and get their newest designs into consumers’ apartments, making the selling process that much easier. Interior designers will be able to upload their room designs to an online design marketplace, which customers can from buy directly, with the designers earning a commision from the furniture companies. We will take a small cut from these “design marketplace” transactions.

The main competitors in the virtual furniture market are Wayfair Virtual Reality and Microsoft HoloLens. These two main competitors offer different products than HoloWorld, but will be able to compete directly for the addressable market. HoloWorld has a sustainable competitive advantage in the form of (future patented) holographic technology. While other competitors in the market offer furniture shopping experiences in the home, none offer a real “untethered” 3D experience. With no glasses or phone obstructing the consumer’s view, HoloWorld is a truly immersive and unique shopping experience.

Our funding ask for today is $250k to build our core tech. Longer term we will need an additional $1.25M ($500k to complete our core technology R&D, $500k for building out the platform, and $250k for operations). Paired with the capable founding team members, we will be able to complete the development of core technology around image recognition, recommendation algorithm, and image projection through hologram visualization. Additional partnerships with Amazon Echo, Google Home, the iPhone, smart TVs, and more will open a whole new set of opportunities that will enhance the customer experience and will surely set HoloWorld on the trajectory towards capturing greater market share.