Pacemaker Predictive Analytics (Pitch)

Team: Shallow Blue

Our solution predicts when someone with a pacemaker is about to experience cardiac arrest, so that a physician can appropriately intervene ahead of time and save the patient from the discomfort of receiving a shock from the pacemaker.

Background on the Problem

The global pacemaker market is expected to reach $12.3 billion by 2025[1], and each year 1 million pacemakers are implanted worldwide[2]. A pacemaker is a small, battery-operated device that is usually placed in the chest to treat arrhythmias, or abnormal heart rhythms. It uses low-energy, electrical pulses to prompt the heart to beat at a normal rate. A similar device called Implantable cardioverter defibrillators (ICDs) can prevent sudden cardiac arrest. There are also new-generation devices that combine both functions.

Pacemaker

Although pacemakers and ICDs can deliver lifesaving therapy, they are not always accurate; up to one-third of patients get shocked even when they shouldn’t be. This potentially leads to adverse health outcomes, as some trials suggest a strong association between shocks and increased immortality in ICD recipients[3]. Thus, there is a real patient need for a solution that identifies and prevents cardiac arrest even before it happens. Identifying patients at risk can prevent shocks, hospitalizations, and even death, and can also generate quantifiable cost savings: a Stanford study suggests $210 million in Medicare savings could be achieved by introducing this type of technology[4].

Description of the Solution

We propose the development of an analytics dashboard for physicians that uses machine-learning algorithms in combination with remote monitoring data collected from the patient’s pacemaker to identify a patient’s risk for cardiac arrest. The algorithm will employ supervised learning as it will initially be trained on de-identified data from patients who have been correctly shocked in the past. This data will be collected from remote monitoring systems, which collect hundreds of data points each and every minute spanning across 60+ variables such as heart rate, activity level, fluid backup, and variability in EKG findings. We found that a number of these variables change in the hours and days leading up to a shock; see the figure below for what a life-threatening cardiac arrest looks like for a device right before it delivers therapy.

Moments leading up to a shock on a device

Our dashboard would essentially build a layer of analytics on top of the existing ICD logic that will improve the accuracy of the shocks and alert physicians when certain changes in variables might indicate that a patient is at risk of cardiac arrest. The model will be based on neural networks combined with a support vector model that can relate patients in real time with those that have received a shock in the past. See the figure below for an example dashboard interface, with the tile in the bottom left corner alerting the physician to the patient’s risk level.

Sample dashboard interface

Empirical Demonstration

We will design a prospective randomized control trial that will randomize patients into either a control group or a treatment group. Each patient will be assigned a risk score by our algorithm. The control group will continue to use their pacemaker/ICD as is, while the treatment group will receive additional preventative warnings generated by our algorithm that will alert them to seek immediate help from a physician. We will measure and compare 1) the total number of shocks delivered; 2) the proportion of shocks that are inaccurately delivered; and 3) the number of “interventions” from our algorithm that resulted from a real, elevated measure of patient risk, as ascertained by the physician. A successful outcome for this demonstration would be an overall reduction in the total number of shocks on a risk-adjusted basis (measure 1), a reduction in the “false negative” rate (measure 2), and a low overall “false positive” rate (as extrapolated from measure 3).

Pilot

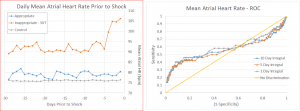
We conducted a pilot study of over 2,500 patients and found that several key variables change prior to shock. The graph on the left shows the elevation in heart rate prior to shock. The graph on the right shows the predictive value of this variable in a univariate regression analysis. As you can see, heart rate on its own already seems to be a fairly good predictor of a shock. We then ran a logistic regression on all 60+ variables to identify multivariate correlations. See the figure below for the results of that model.

Univariate regression analysis (using heart rate)

Multiple regression analysis

[1] Grand View Research, December 2016: http://www.grandviewresearch.com/press-release/global-pacemaker-market

[2] Mond, H. G. and Proclemer, A. (2011), The 11th World Survey of Cardiac Pacing and Implantable Cardioverter-Defibrillators: Calendar Year 2009–A World Society of Arrhythmia’s Project. Pacing and Clinical Electrophysiology, 34: 1013–1027.

[3] Schukro, C. (2014) Implantable Cardioverter-Defibrillators Shock Paradox. e-Journal ESC Council of Cardiology. Vol. 13, No. 9, 16 Dec 2014.  https://www.escardio.org/Journals/E-Journal-of-Cardiology-Practice/Volume-13/Implantable-cardioverter-defibrillators-shock-paradox

[4] Medscape. “New Pacemakers, ICDs With Home Monitoring Save Time.” http://www.medscape.org/viewarticle/433442

Blue River Technology

Blue River Technology – Solution Profile (Shallow Blue)

Maker of See & Spray and LettuceBot

Outline of the Problem

Drone equipped with See & Spray technology.

See & Spray

At large farms, it is standard practice to spray an entire field evenly when a weed or pest problem emerges.  This uniform treatment of the crop can result in excessive use of pesticide and herbicide.  There are also environmental and food contamination concerns regarding the use of these pesticides and herbicides. The goal of See & Spray is to decrease the amount of chemical use in agriculture.

Blue River Technology (BRT) developed agricultural machines that utilize machine learning to distinguish between weeds and plants based on their size, shape, and color as the machines drive over fields.  The machines spray the chemicals in the exact spots they are needed, preventing chemical overuse. The robotics technology allows the smart machine to precisely spray herbicide on the field.

Tractor using LettuceBot thinning system

LettuceBot

At times, farmers tend to over plant certain crops, and so will thin out the crop to improve overall yield. Thinning out the crop is a labor-intensive and expensive process.

LettuceBot is a BRT machine-learning powered machine that is able to photograph 5,000 plants a minute, “using algorithms and machine vision to identify each sprout as lettuce or a weed.”  The plants can be identified by graphics chip in just .02 seconds. LettuceBot is also able to determine whether crops have been planted too close to each other, which could inhibit their growth.  If that is the case, it will spray and kill one of the plants without harming the other, increasing overall crop yield. This automates a normally labor-intensive process.

Evaluation of Effectiveness

BRT claims the See & Spray technology can decrease chemical use by a factor of 10. The accuracy of the machine is within a quarter of an inch. This can result in both cost savings to farmers in terms of fewer pesticides, and fewer environmental and food contamination concerns. However, most pesticides are fairly inexpensive, so cost savings are not huge, and we view this product as only moderately effective.

Given the normally manual nature of lettuce thinning, LettuceBot produces significant labor cost savings for farmers. LettuceBot is currently in use on 10% of the lettuce fields in the U.S., and this relatively wide adoption highlights how this product has been very successful so far.

Proposed Alterations

Below are six proposed alterations for BRT’s machines:

  1. Improve specificity in identifying weeds

There are many different species of weeds that all have different optimal control agents, and weeds are starting to get more resilient; it is therefore becoming more important to identify exactly which weed is growing. BRT could incorporate multiple herbicides into its See & Spray machines and tailor them to the specific weeds identified.

2. Introduce nutrient spraying in addition to herbicide spraying

Given BRT’s existing technology, it should be fairly simple to incorporate targeted nutrient spraying for certain plants, such as plants that look small or weak. This would add an additional value proposition for farmers that does not already exist, as they could accomplish both tasks in one go.

3. Incorporate soil analysis into herbicide and nutrient spraying decision

The efficacy of certain herbicides can depend on the type of soil that the crops are growing in. Analyzing soil can allow for supplementation of nutrients for optimal crop growth.

4. Expansion of LettuceBot to other crop types

BRT should leverage its machine learning algorithms to teach its products to identify other plants, so its products can be used to thin multiple types of crops beyond just lettuce.

5. Market “Low-Pesticide” products

Given the recent popularity of organic foods, BRT should encourage their customers to promote the fact that their crops use 90% fewer pesticides. This would appeal to a health-conscious market and generate stronger sales for farmers, and thereby increase demand for BRT’s products.

6. Sell crop data to third parties

BRT’s products currently gather a wealth of data on the real-time quality of plants across all of its customers. This data could potentially be aggregated at a trend level and resold to financial groups (while protecting individual farmer anonymity) such as hedge funds that are trading agricultural futures.

Shallow Blue – Nikon Profile


Nikon Retinal Imaging – Solution Profile

  • Will Thoreson-Green (Student ID: 12148843)
  • Curt Ginder (Student ID:440345)
  • Holly Tu (Student ID: 12137544)
  • Tom Kozlowski (Student ID: 10452411)
  • Ram Nayak (Student ID: 12131499)

We pledge our honor that we have not violated the Honor Code during this assignment.

  1. Outline of the Problem

Diabetic retinopathy is a disease due to diabetes that causes damage to the retina. It is the leading cause of blindness among Americans ages 20-64, affecting 40-50% of people with diabetes and accounting for 12% of all new cases of blindness in the United States. Diabetic retinopathy often does not have early warning signs, but the disease can be detected early on by the presence of microaneurysms in the eye. If new cases are detected early, at least 90% of cases could be reduced by proper monitoring and treatment. Diabetic macular edema is a complication of diabetic retinopathy due to fluid buildup, affecting 10% of people with diabetes. Early detection of these two diseases could lead to prevention of significant vision loss and blindness.

2. Nature of the Solution

Nikon and Google’s Verily Life Sciences have partnered to develop a machine learning-enabled retinal imaging solution that will allow for earlier detection of diabetic retinopathy and diabetic macular edema. The underlying technology is Nikon’s ultra-widefield high resolution digital images that capture approximately 82% of the retina. Verily is working on developing a machine learning algorithm that can then read these images and detect early signs of retinopathy in patients with diabetes. They are most likely using the recently acquired data on over one million eye scans from the National Health Service (NHS) to help build this algorithm.1 Interestingly, Kaggle had launched a competition back in 2015 with this exact objective, and the winning algorithm had a 10% higher “agreement rate” than the human-only approach (indicating that the algorithm and a single human expert agreed on a diagnosis more often than two human experts did).2

3. Evaluation of Effectiveness

According to a peer-reviewed article, the Verily system performed at a high level of sensitivity and specificity (97.5% and 93.4%, respectively) compared to the “gold-standard,” as determined by majority decision of a panel of expert ophthalmologists.4 These results were duplicated in an entirely separate dataset. While the results of the technology are promising, the chance of competition replicating the technology is great given the publicly available dataset of retina images that can be used to train the algorithms. Additionally, there are some outstanding concerns regarding the generalizability of the technology to images outside of the datasets used for training and validation. Further testing in actual clinical settings is a necessary step prior to a mass scale implementation.

4. Proposed Alterations

The addition of additional physiologic and early pathologic variables might improve the accuracy of the solution. For example, laboratory values of other end organ damage (microalbinuria, creatinine kinase, HbA1c) could augment the visual findings from the retina imaging.

Additionally, the visual ophthalmologic findings could be applied to early detection of other diseases, such as hypertension, that are not typically evaluated through retinal imaging. Augmented with a medical professional’s judgement of other risk factors, this combined approach might improve targeted preventative treatment for a variety of diseases that are otherwise difficult to predict.

The application of the algorithm in an appropriate clinical context could ensure an improvement in the detection and treatment of diabetic retinopathy, especially in resource constrained settings. Currently, the American Diabetes Association recommends patients with diabetes have an annual examination by an ophthalmologist.5 For areas without access to ophthalmologists, this solution could improve the diagnostic capabilities of a mid-level or general practice provider that lacks specialized training.


Sources:

  1. Hodsden, Suzanne. 2017. “Nikon, Verily Partnership Combines Machine-Learning With Advanced Retinal Imaging.” Med Device Online. https://www.meddeviceonline.com/doc/nikon-verily-partnership-combines-machine-learning-with-advanced-retinal-imaging-0001
  2. Farr, Christina. 2015. “This Robo Eye Doctor May Help Patients With Diabetes Keep Sight.” KGED Science. https://ww2.kqed.org/futureofyou/2015/08/20/this-robo-eye-doctor-may-help-patients-with-diabetes-keep-sight/
  3. All figures taken from https://en.wikipedia.org/wiki/Diabetic_retinopathy (all scholarly articles cited in wikipedia) and https://news.fastcompany.com/verily-and-nikon-will-develop-machine-learning-tools-to-screen-for-vision-loss-4027884
  4. Varun Gulshan, PhD; Lily Peng, MD, PhD; Marc Coram, PhD1; et al. Development and Validation of a Deep Learning Algorithm for Detection of Diabetic Retinopathy in Retinal Fundus Photograph. Journal of the American Medical Association. http://jamanetwork.com/journals/jama/article-abstract/2588762
  5. David K McCulloch, MD, et al. Diabetic retinopathy: Screening. UpToDate. https://www.uptodate.com/contents/diabetic-retinopathy-screening