Team Awesome: PredPol – hoax or the future of crime prevention?

The problem: violent crimes on the rise in U.S. cities

Crime rates have remained steady or even decreased in major metro areas across the U.S. in the last decade. However, violent crimes have increased over the same time period. Social and political pressures around law enforcement reform continue to mount across the country, forcing police departments to focus on reducing violent crime rates while limiting police force discrimination.

As a trend, crime tends to proliferate in areas where it has successfully been carried out previously1. Furthermore, the severity of crime tends to escalate in those areas. In a neighborhood where an individual can get away with graffiti, the next crime may be theft or burglary, and so on. Increasing staff and patrols is not a scalable measure. In order to more efficiently prevent crime rather than react to it, police departments are turning to data.

Solution: predictive policing

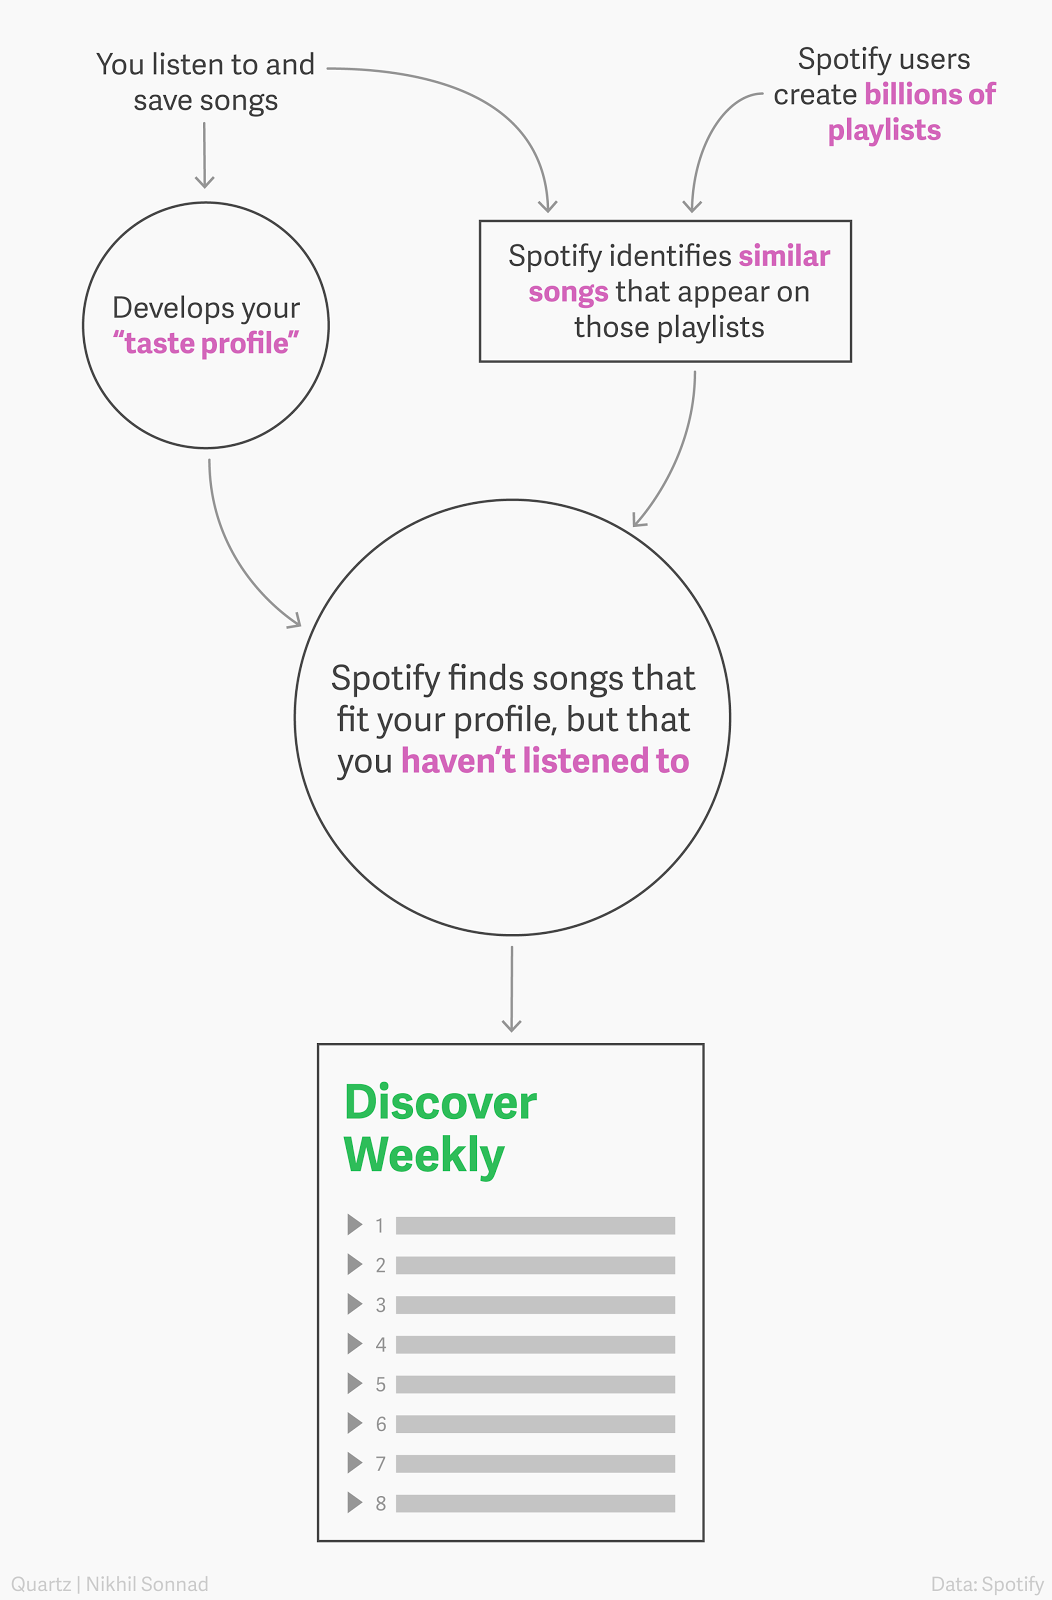
Predictive policing has emerged as a method to leverage data in order to predict locations where crime is likely to occur. Through a machine learning algorithm, it takes past crime data and identifies people at risk socially, as well as areas where crime is more likely.

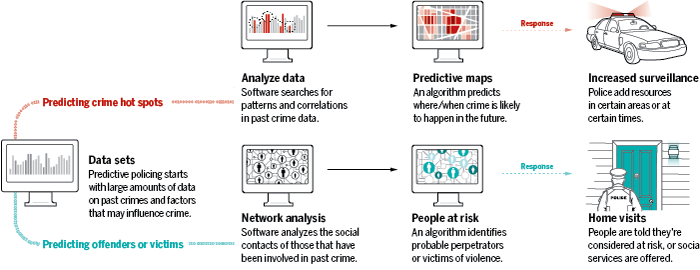
Source: http://www.sciencemag.org/news/2016/09/can-predictive-policing-prevent-crime-it-happens

One of the most dominant companies in the predictive policing space is PredPol2, a private predictive analytics service that takes data from a local department and uses a machine learning algorithm to produce a daily output of predicted future crimes. The aim of predictive policing is not necessarily to predict the type of a crime, but to predict the location and time it will occur. The goal is to allow individual departments to position police in the best locations to discourage localized criminal activity.

How does it work? First, PredPol takes several years of data to lay a background level of crime activity and map data across the local area. This is done using an Epidemic Type Aftershock System (ETAS), similar in concept to the way scientists predict earthquakes. PredPol takes data from a police department’s Record Management System (RMS) daily to collect information and inform the algorithm. According to the PredPol website, they use three key metrics: date/time, location and crime to predict the location and time of future crimes. This translates into a report with pink boxes indicating areas with high potential for crime that police should patrol.

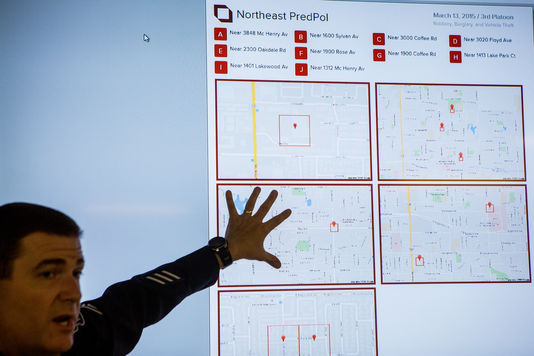
PredPol “Pink boxes” of high traffic crime areas. Source: PredPol.com

Effectiveness

PredPol cites anecdotal successes such as a 20% reduction in crime in LA over the course of a calendar year. However, it is difficult to validate such claims. Because the algorithm is proprietary, outside academics and data scientists are unable to provide accurate assessments. The RAND report is the most comprehensive third party review to date of predictive policing, and concludes that the impact of predictive policing is lukewarm at best. In fact, preliminary results show that with increased predictive power there are diminishing returns.

One of the issues with understanding its effectiveness is it is unclear what the benchmark for success should be. As one article cites, it could be argued that what PredPol actually predicts is future police activity3. Without reliable proof of causation, we are left with doubts as to whether PredPol actually reduces crime, or if its predicted police movements coincide with activities that would have occurred anyways.

Challenges and proposed alterations

Two primary challenges face PredPol, and organizations like it. The first is proving that the algorithm actually helps businesses fight crime. More academic research from institutions with the ability to effect randomized control trials needs to be developed. One proposed solution would be to measure changes in police behavior during idle times3, i.e. when they are not on patrol or responding to a call. If PredPol’s pink boxes encouraged them to patrol an at-risk area they would have otherwise missed, then it may be easier to measure effectiveness in a controlled setting.

Second, the organization needs to provide evidence that it does not encourage racial profiling. While in marketing materials, PredPol makes soft claims that it is unbiased, by its very nature it is bringing further focus on black and brown neighborhoods. This may further encourage racial and social bias of police officers through confirmation.

References

  1. http://www.sciencemag.org/news/2016/09/can-predictive-policing-prevent-crime-it-happens
  2. http://www.predpol.com/results/
  3. http://www.slate.com/articles/technology/future_tense/2016/11/predictive_policing_is_too_dependent_on_historical_data.html
  4. http://www.economist.com/news/briefing/21582042-it-getting-easier-foresee-wrongdoing-and-spot-likely-wrongdoers-dont-even-think-about-it


Women Communicate Better: Spotify

The Problem

Recommending music without user data is referred to as the ‘cold-start problem’ and is exactly the problem that Spotify wants to solve. This problem arises because it’s nearly impossible to recommend new and unpopular music because by definition, that type of music lacks usage data to base recommendations off of. Spotify wants to be able to introduce people to bands and songs they’ve never heard.

Spotify’s Algorithm

Spotify uses “Collaborative Filtering” to identify users with similar musical taste in order to recommend new music. Basically, User 1 listens to two Justin Bieber songs, also loves the new single from Justin Timberlake, and stores them all in their “Justin^2” playlist.  Then, if User 2 also enjoys the same two Bieber songs, the Collaborative Filtering will recommend the new J.T. single to User 2.

The next step comes from a music analytics startup that Spotify acquired called Echo Nest. The Machine Learning from Echo Nest goes above and beyond matching playlists or preferences. The program reads the articles about music and attempts to quantify the descriptions of new music in a way that allows Spotify to bucket songs and artists, and then recommend them to users. This process (Natural Language Processing) is also used to read the titles of billions of user-generated playlists and categorize the songs by the user-generated titles. Using these buckets from the music press and user playlists, Spotify then creates a “taste profile” or a mix of which categories of music the user most enjoys, and their magnitudes.

Spotify also uses deep-learning on actual audio files. Some attributes of music are easier to find from audio files, like which instruments are used or how fast the beat goes, while other attributes are harder to identify through listening, like genre and age of songs.

These computer generated inputs to the recommendation algorithm are also filtered by some human editorial limits. For example, certain genres like white noise albums are filtered out, and they turn off the Christmas music after…well, Christmas. These guardrails keep the algorithm from making understandable but annoying mistakes.

Effectiveness of Spotify

Spotify’s effectiveness is evidenced by the fact that in March 2017, the company hit 50 million paid subscribers as well as 100 million users.  In comparison, Apple Music has 20 million subscribers, Tidal has 3M and Pandora has 4.5M.  This indicates that Spotify’s features, including selecting specific songs, downloading music, playlist curation and lack of advertisement has been wooing users to the site and converting them to paid users.  

The ability to purchase and afford musical content will continue to challenge Spotify, as it has for Netflix, in order to have music that users want to listen to.  This is where Spotify’s “Discover Weekly” or “Daily Mix” can continue to attract users with new music that has lower acquisition costs.

Improving Spotify

While Spotify has an advanced machine learning based algorithm, there may be opportunities to use human-machine interactions to improve the algorithm. They already leverage their human network by identifying early adopters to source their “fresh finds” playlist, and this approach can be expanded more broadly to other curated content across the site. Similar to Pandora, which uses more human sensor input. The musicology team at Pandora developed a list of attributes like “strong harmonies” and “female singer” and human sensors graded these inputs. The limitations of these human sensors are obvious, but Pandora failed when it was unable to transition from radio and recommendations to providing on-demand plays of specific songs.

There is also potential for music video integration in the same vein as YouTube’s new video curated playlists. Spotify could look to pool a library of music videos and pair them with song selections or curate specific video recommended lists based on a newly developed algorithm. There is also the potential to incorporate voice recognition, which has already been piloted by Amazon Unlimited through Alexa. Voice recognition could provide valuable integration with voice recognition software and hardware from Google home to Microsoft’s Cortana for more on demand searches. With many new technology services from voice to video emerging, Spotify has the opportunity to build out unique video and voice experiences within its platform to drive a more extensive music platform for its customers.


Sources:

http://benanne.github.io/2014/08/05/spotify-cnns.html

https://www.forbes.com/sites/quora/2017/02/20/how-did-spotify-get-so-good-at-machine-learning/#2142872f665c

https://qz.com/571007/the-magic-that-makes-spotifys-discover-weekly-playlists-so-damn-good/

https://www.slideshare.net/MrChrisJohnson/from-idea-to-execution-spotifys-discover-weekly

https://techcrunch.com/2017/03/02/spotify-50-million/


By: Women Communicate Better (Chantelle Pires, Emily Shaw, Kellie Braam, Ngozika Uzoma, David Cramer)

Wear – Final Pitch

Wear


The problem

When it comes to apparel, there are adventurous and conservative shoppers. Adventurous shoppers spend hours researching, browsing, experimenting, and trying on different styles of fashion, and have fun doing it. Conservative shoppers just want to occasionally purchase slightly different hues of the clothes they have worn for years, and the idea of shopping fills them with dread. They like to stick with the familiar because they often cannot visualize how different styles of clothes can look. The problem is often not that these shoppers are unwilling to wear different apparel, but that they are unwilling to put in the search costs. The unwillingness to experiment constrains the growth the $225bn apparel market and contributes to a fashionably duller world and opens up an opportunity for us.


Wear – The solution

The team proposes an augmented judgment system that uses a shopper’s non-apparel preferences to predict apparel preferences that they may not be aware of. For example, if [Wear] knows that a shopper likes James Bond movies, enjoys wine tastings, drives a Mercedes, spends 45 minutes every morning for personal grooming, and prefers to eat at Grace, it would predict the type of apparel the shopper would like through a model that connects non-apparel preferences to apparel tastes. [Wear] would then remove apparel styles already owned by the shopper from the output to form a set of recommendations of new styles the shopper may like. This model will use augmented perception techniques to understand different parts of the user’s environment that provide insight into their preferences. The algorithm will form user’s profile by sourcing user preferences from three key sources: 1) user’s social media accounts such as their twitter posts and who they follow, facebook event posts, instagram likes, yelp posts etc., 2) current retailer accounts to track their purchase history for apparel as well as apparel purchases like Macy’s, Ticketmaster, eventbrite etc., and 3) direct self data input by users, such as color choices of their current wardrobe, size/fit preferences, and category of recommendations needed (t-shirts, jeans, etc.). The result would be distinct from that produced for a shopper who likes Mission Impossible movies, enjoys dive bars, rides a Harley Davidson, spends 5 minutes on personal grooming, and prefers to eat at Smoque BBQ. The algorithm will generate apparel recommendations that fit the needs and preferences of shoppers who may not understand their own preferences, leading to higher consumer willingness to purchase new apparel and higher industry sales.


Typical user profile

Our target user market is 18-35 year olds (millennials) who are tech savvy and fashion conscious. We are targeting all income brackets and both men and women. In total, we expect our target addressable market to be 75 million users.


Use cases

Common use cases that we expect are: users shopping for themselves or for a gift for someone else either for a special event or as part of their routine shopping, for example to replenish one’s closet before a new year at school. The platform would allow the user to make choices on what they intend to do, and what they are looking for (like, a particular type of clothing item), and how far out of their comfort zone do they want to go. We define it as filling the gaps in the closet or extending the closet by being adventurous.


Business model

We plan to launch our platform first with big department stores like Nordstrom, Macy’s. The reason being that 1. [large department stores] already have lot of user data which gives [Wear] a good starting point, 2. they are investing in boosting their digital sales and 3). They are facing intensified competition from various international brands. We plan to then leverage the success and connect our platform with international brands. The users will get the recommendation based on algorithm and also links to the department stores where that particular item could be bought from. If a sale is activated through our platform then [Wear] gets 3% of the GMV.


In a steady state we expect to generate annual revenue of $190M. This is assuming we penetrate 10% of the $63 billion US clothing market which is serviced through e-commerce channel. The average price of an item is $19, showing that all income brackets are appropriate to target. The average per capita spend on clothing is $978 per year, but our target market spends nearly twice that, at $1,708 per year. Although, our revenue estimate uses all apparel e-commerce as our baseline, but our target customers spend more than average, so this estimate is conservative.


The demonstration

In order to demonstrate the potential success of our platform, we would compare not just the analytical power of our model but also the process that the user currently goes through to purchase new items for his/ her wardrobe. Therefore, for our test users we will have them get recommendations from three sources: select a piece of clothing they want to add to their wardrobe themselves, have a sales agent at a store such as Nordstrom give them a recommendation, and have our product give them a recommendation. For each of the three scenarios, we will test the inputs to the user, and how the user reacts to each of them. For inputs to the user, we will judge what inputs and data sources are used by each of the methods, and what information is actually provided to the user and in what form. We think that part of the reason we are differentiated is our process of asking about the user’s personality outside of their wardrobe, which other sources often may not. On the output side, we will judge the user’s reaction in terms of what they thought about the efficiency and convenience of the process, whether they end up purchasing the recommended apparel, and whether they valued the experience enough to return/ recommend it.


The funding

We are looking to raise $750k at this stage. These funds will be used for building the product MVP, acquiring 500k users and one big department store as customer by Q4 2018.

Sources:

https://www.statista.com/topics/965/apparel-market-in-the-us/

https://my.pitchbook.com/#page/profile_522553643

Aerial Intelligence Response

In the event of natural disasters, aid delivery and disease prevention are inefficiently delivered due to lack of information. We use drone imagery and predictive analytics to plan aid delivery efforts and prevent outbreaks following natural disasters

In 2015, there were 376 natural disasters that registered resulting in $70.3B in damages, which is actually below the 10-year trailing average of ~$160B.[1] In addition, these disasters can result in slowed economic growth due to loss of infrastructure, productivity decreases, labor supply losses etc. bringing total average yearly cost to ~$250-$300B[2]. While the overall number of disasters has been trending up, flooding is the most common natural disaster over the last 20 years accounting for ~45% of total natural disasters recorded. On the other hand, storms tend to have the costliest immediate impact (See Figures 1 & 2)[3].


Despite these enormous costs, the distribution of aid is relatively inefficient to this day, which causes more costs to be incurred than is needed. For example, during the earthquake in Haiti back in 2010 even though there were over 900 NGOs on top of the UN, military, and other organizations who came in to help, aid distribution was severely delayed due to communication gaps, logistical issues with the collapse of infrastructure, and overall coordination[4]. In addition, disaster relief spans not only the initial rescue, medical, food, water, and shelter assistance but also longer term infrastructure rebuilding and potential disease and outbreak mitigation efforts due to population displacement and unsanitary conditions. In the US, we find that the federal government ends up shelling out the majority of funds with states and other organizations following suit, so there is definitely demand for cost reduction.

Modern communication technology has helped in requesting for assistance and mobilizing relief in a matter of hours. However, the task of humanitarian logistics[5] lies with the authorities on the ground which include relief organizations, local governments and emergency services. Humanitarian logistics prioritizes quick response and demand satisfaction over profit as being important parameters while delivering relief. In other words, the right goods should reach the right place, at the right time (within the shortest possible time) to those who need it the most. While disaster preparedness remains a top priority for governments and technology has been incorporated in aid mobilization, research[6] indicates that limited assess visibility and procurement could have helped minimize the impact of Katrina.

Given this assessment, we see two key need areas where we believe that technological advances could be valuable. The first is optimizing aid delivery efforts by generating satellite images of the landscape of an area hit with a natural disaster instead of solely relying on volunteers on the ground to classify damages and other potential risks such as people who are trapped and standing water that could lead to infestation and disease as well as the distribution of the population and water sources to allocate food and water effectively. By acquiring this knowledge quickly and without significant additional human effort, we believe that the government and organizations could more efficiently diagnose how and where to allocate efforts from the get-go. The second need area we identified relates to the long-term costs of post-disaster disease outbreaks. We believe the data generated from the satellite imagery captured during initial relief efforts can also be used as inputs to predict the likelihood of disease outbreaks such as malaria and dengue.

Our product Aerial Intelligence Response uses surveillance data and machine learning to assist with effective disaster response plans and minimize disease outbreaks.

  1. CAPTURE accurate view of the disaster region through drones
  2. This allows agencies to ASSESS immediate impact of disaster. For instance, damaged infrastructure and areas prone to flooding can be instantly identified using machine learning algorithms that compare against
  3. DEPLOY aid and evacuation capabilities based on need and extent of damage.

Using machine learning to improve humanitarian logistics

After a disaster, response teams are short on critical information related to infrastructure, health, and safety.  The first stage in our response plan is to use drone technology to create an accurate map of the affected areas.  Commercial drone systems outfitted with image, infrared, and LIDAR sensors are deployed in order to collect data.  A single drone is able to survey approximately 3 acres of space per minute, meaning a fleet of 100 drones would be able to scan an area approximately the size of the city of Chicago in just 8 hours[7].  Open source flight planning and autopilot technology allows for the simultaneous deployment and monitoring of the drones at an extremely low cost[8].

Following this survey, the data collected by the drones is uploaded to a cloud-based storage system, and processed into an orthorectified, multi-layered map.  This process takes place using several computer vision algorithms such as keypoint detection for image stitching[9], and Structure from motion (SfM)[10] for creating three-dimensional maps from two-dimensional images.  The map data can be viewed in a browser-based tool in order to assess the situation or annotate the images with additional metadata.

Once a complete survey of the affected area has been generated, machine learning algorithms are used to automatically identify key points of interest in the data such as infrastructure damage and equipment.  This helps responders plan for and optimize the distribution of aid.  These algorithms can also classify natural features of the landscape such as homes, vegetation, and areas of flooding.  These data are then used as inputs to forecasting models for predicting future disease outbreaks.

From a technical standpoint, the machine learning algorithms used to automatically classify the drone survey data are a class of deep learning models called convolutional neural nets (CNNs).  These CNNs are networks that take in image data as input and generate a pixel-wise classification of the content of the image.  Our approach uses two specific, open source[11] network architectures in order to detect objects and classify the scene.  The first model, used for finding objects such as equipment, vehicles, or infrastructure, is called Faster RCNN[12].  The second architecture, called fully convolutional semantic segmentation networks[13], allow us to take the image and infrared data returned by the drone and generate a map layer displaying where different features of the landscape are located.

After drone data has been captured and analyzed, it is fed into a database which includes data on conditions which may impact the spread of communicable diseases.  Examples include number of inches of rainfall, humidity conditions, and the temperature range by latitude and longitude of the surveyed area. A machine learning algorithm trained on historical data is then used to forecast the probability of the disease spreading through the region. Based on this, the software can populate a heatmap with probabilities and compare to actual infected areas.  This information is critical for groups considering the optimal distribution of resources[14].

Measuring success

AIR will be deployed to state and national governments, WHO, Salvation Army, FEMA, EPA, and American Red Cross, among others, to direct aid efforts better and prevent illnesses from becoming outbreaks by isolating infected areas. AIR’s success will be measured by the improvement in on-the-ground personnel response time, reduction in physical supply waste, reduction in post-event hospitalization rates and time saved in reaching target locations.

The effectiveness of this technology relies on disaster response agencies’ abilities to be tech savvy and willing to learn the technology. Initial database needs to be populated with open source learning libraries and network architectures must be tested to ensure they will be sufficient for timely processing and analysis of the aerial surveys. Government agencies’ openness to change and willingness to steer away from current procedures will also be critical to AIR’s adoption and success.

Funding Ask [Update]

We request $200,000 of funding in order to test and build the survey-classify-annotate model and build partnerships with potential client organizations. 

This will enable our venture to fund:

    • Contract UAV aircraft and pilots
    • Cloud server space
    • Commercially available software
    • Travel expense

References
[1] http://reliefweb.int/report/world/annual-disaster-statistical-review-2015-numbers-and-trends
[2] https://www.forbes.com/sites/marshallshepherd/2016/05/12/weather-caused-90-of-natural-disasters-over-the-past-20-years-and-impacted-the-global-economy/#6c749862671d
[3] http://www.emdat.be/
[4] http://insidedisaster.com/haiti/response/relief-challenges
[5] http://ac.els-cdn.com/S1877705814035395/1-s2.0-S1877705814035395-main.pdf?_tid=e4a518c0-329f-11e7-857a 00000aacb360&acdnat=1494104977_e7dfa68e900fa0e247d652699d678027
[6] http://transp.rpi.edu/~HUM-LOG/Doc/Vault/katrina1.PDF
[7] http://cmemgmt.com/surveying-drone/
[8] https://pixhawk.org/modules/pixhawk
[9] https://en.wikipedia.org/wiki/Image_stitching
[10] https://en.wikipedia.org/wiki/Structure_from_motion
[11] https://github.com/rbgirshick/py-faster-rcnn
[12] https://arxiv.org/pdf/1506.01497.pdf
[13] https://people.eecs.berkeley.edu/~jonlong/long_shelhamer_fcn.pdf)
[14] https://wwwnc.cdc.gov/eid/article/13/1/06-0779_article

HiPo! – Final Presentation Pitch (Ex Machina Learners)

The Problem and the Opportunity

The current college admissions process is flawed. Despite the best efforts of admissions officers to build diverse student classes that have high potential for success, there is little proof to suggest that current application review processes are robust and result in ideal class compositions. A 2006 study by Simonsohn showed that admissions application reviewers weighted the social aspects of an application (e.g., leadership) more heavily than other attributes (i.e. academic factors) on days that were sunny. This worrisome finding demonstrates the outside factors that can affect a human’s judgement and have significant impacts on prospective students’ lives.

A 1996 empirical study conducted by a political scientist at Northwestern University found that the likeliest determinants of admission to college were the standard test scores, grades, and personal information that could be found in one’s application – not the unique, signal characteristics admissions officers claim to look for in essays and interviews that could lead an officer to make a more complete evaluation of the candidate. Perhaps even more worrisome is that admissions offices, outside of those at some of the top universities, do not evaluate the outcomes of application decisions – such as the success of an admitted student or the future financial benefits to the institution of that student’s acceptance – and incorporate that feedback into their admission evaluation criteria.

In addition, the application review process at most universities is still largely manual, requiring admissions officers to read, evaluate, and discuss tens of thousands of applications multiple times each year. The significant time spent on even the most clear-cut of cases (either acceptances or denials) . In a University of Texas study of how a machine learning solution could aid PhD application review processes, it was observed that reviewers spent over 700 hours reviewing a pool of 200 applicants. Now, consider that many of the top universities receive tens of thousands of applicants.

Therefore, we see a clear opportunity for a machine learning-based solution to address the existing flaws in the college admissions process. Not only is there a large capturable market with over 3,000 institutions of higher education in the U.S. that all face this admissions evaluation issue, the number of college applications continues to increase, which will only exacerbate the issues described above.

Our platform, HiPo!, will help provide significant time and human resource savings to university admissions offices. In addition, it will be trained using historical application and student performance data to help admission officers optimize their admissions evaluation process across a number of outcome-based factors (e.g., future earnings potential, yield likelihood, philanthropic giving potential).

The Solution

The proprietary algorithm will utilize a semi-supervised machine learning model. The supervised elements that the model will optimize for are the quantifiable outcomes such as future earnings potential, yield likelihood, and philanthropic giving potential. However, given the vast expanse of data that the model will be trained on through years of qualitative data from student essays and interview transcripts, there are other elements that, in an unsupervised way, the algorithm can make associations and clusters from to derive additional predictive value. These elements are not as measurable such as creativity or diversity of thought – both things that an admissions committee would value in a class. However, over time if the algorithm can add additional measurable information to admissions officers on these dimensions, they would provide additional evaluative data.

The inputs into the core product are traditional quantitative metrics, such as GPA, standardized testing scores, etc., in addition to qualitative inputs such as essays, interview transcripts, recommendations, and resumes. HiPo! recognizes that each institution may have a different idealized student profile, and these may even vary across different types of programs at that institution (e.g., law school vs. business school vs. undergrad). By creating a robust feedback loop by measuring the success of various students over time based on the HiPo! evaluation criteria, the algorithm will be able to estimate outcomes and provide admissions officers with quantifiable score reports:

This is merely a prediction of the relative likelihood of future outcomes based on historical results of similar profiled candidates (out of 100), not a pure measure of an individual’s current attributes.

Empirical Demonstration

To validate the effectiveness of the machine learning algorithm and to validate the hypothesis that certain characteristics and patterns present in an candidate’s application, essays, and interviews are reflective of future outcomes, the HiPo! team would perform a demonstration pilot by partnering with an institution of higher education, such as the University of Chicago Booth School of Business. HiPo! would collect historical applicant records from 1950-1992. 75% of this data would be randomly selected to train the algorithm, under the supervised and unsupervised learning methods described above. The algorithm would then be applied to the remaining set of the data. The predictive output of the solution would be measured against actual outcomes of the students evaluated in the sample. For instance, if Michael Polsky MBA ‘87 was evaluated as part of the sample, a successful algorithm would predict that he would have both high career earnings potential and strong likelihood of philanthropic behavior.

Following this initial demonstration, HiPo! Will undergo a more substantial pilot with multiple institutions, focused on optimizing the algorithm for one specific academic program (e.g., MBA) and the ability to “flex” parameters in its algorithm based on institutions’ desires.  With highly competitive MBA programs constantly measuring themselves against one another while jockeying for rankings and admitted students, hitting specific metrics (e.g., yield) and demonstrating students’ program-driven success is critical.  During the pilot, HiPo! will work with each involved university on the types of class profiles the school hopes to optimize for in its admissions process; one institution may hold social impact as a core component of its mission, while others may want a stronger profile of entrepreneurship. Increasing the repository of data from diverse unbiased sources will even further strengthen the algorithm’s predictive ability to even further tailor the solution to individual clients.

Risks and Mitigants

There could be push back from universities who are concerned that its applicants will be able to “game the algorithm” by using targeted keywords and language in essays to increase the likelihood of recommendation by the engine.  However, we assume institutions will operate in their best interests to keep their algorithm highly confidential, preventing this from ever becoming a risk in the first place.  In addition, this is easily mitigated through continuous learning and updating of the algorithm. In fact, many students are already attempting to “game the system” in their essays anyway through targeted language throughout their application to catch the eye of admissions staff.  

Finally, we see a potential risk with institutions ignoring the mission of HiPo! as a complementary tool to assist admissions staff, and instead relying exclusively on it to make admissions decisions.  We strongly discourage completely removing the human element from the decision process.

Funding Request

To build the platform that will be used for the demonstration pilot described above, HiPo! is seeking a $200,000 investment that will be used to hire technical development staff. This number is based on the anticipated salary needs for 2-3 full-stack developers and machine learning experts for a period of 6 months. We anticipate also using these funds to prototype our data management system that will be used to house both historical and customer data that will serve as inputs into the machine learning algorithm.


Sources

Cole, Jonathan R. “Why Elite-College Admissions Need an Overhaul.” The Atlantic. Atlantic Media Company, 14 Feb. 2016. Web. 13 Apr. 2017.

Estrada-Worthington, Rebecca, et. al.  “2016 Application Trends Survey Report”.  Graduate Management Admissions Council. 2016. Web. 1 May 2017.

Fast Facts. N.p., n.d. Web. 13 Apr. 2017.

Friedman, Jordan.  “Explore College Admission Trends at Top National Universities”.  U.S. News.  22 Sept 2016.  Web.  13 Apr. 2017.

Miikkulainen, Risto, Waters, Austin. “GRADE: Machine Learning Support for Graduate Admissions.” Proceedings of the 25th Conference on Innovative Applications of Artificial Intelligence, 2013.

Simonsohn, Uri. “Clouds Make Nerds Look Good: Field Evidence of the Impact of Incidental Factors on Decision Making.” SSRN Electronic Journal (n.d.): n. pag. 2006. Web. Apr. 2017.

Introducing Poppins, the Intelligent Parenting Assistant

Poppins, the smart baby monitor that predicts why your baby is crying, is here to help guide new parents through the labyrinth of raising a child. We are requesting $200,000 to develop the initial prototype and fund a study to prove the effectiveness of the device on raising healthy children and assuaging parental fears.

Millenials worried about parenting

There’s nothing more important to people in this world than their babies. A Pew Research study found, about half (52%) of Millennials say being a good parent is one of the most important things to them compared to 42% of Gen-Xers at a comparable age.

Yet, children don’t come with an instruction manual. And, as every new parent learns, it can be a terrifying job—with the feedback erring on the negative side: your child will scream and cry for hours.  On average, newborns cry for about two hours each day. Between birth and about 6 weeks of age, this typically increases to almost three hours each day! How do we help parents, in real-time, know what to do when their baby cries? Even further, how do we limit the many frustrations and anxieties that stem from being unsure about what to do? Existing baby monitor technology fails to provide an intelligent guidance solution for why your baby is crying. They can only alert you, show you images of your child, and provide biometric information. What if we could do more with data to provide real-time recommendations for parents in their time of need? The baby monitor market is expected to grow between 8.5 – 11% over the next 5-7 years and reach $1.4 billion over that time. This growth is primarily driven by changing habits in households with two employed parents who want to stay remotely connected to their baby combined with increased awareness of baby safety issues and online retailing. Innovation in this space has led to a generation of high-priced, smart baby monitors with features such as infrared night light, in-built lullabies, and temperature sensors. Our solution goes beyond monitoring and into predicting the right action to help your child. Introducing Poppins, an intelligent parenting assistant that helps parents determine the best course of action when their baby cries.

Poppins is here to guide new parents

Faster than you can say “Supercalifragilisticexpialidocious” Poppins is here to help you be your best parent. Worried about waking up to the sound of your child crying and not knowing what to do? Does that specific cry mean it’s hungry, lonely, or even in danger? Using a prediction model built with childcare experts and your child’s past behavior, Poppins will use the pitch of the cry, the time of night, the baby’s age, motion sensor technology, and other inputs to predict a range of reasons for the crying, as well as recommend steps to help get your child back to sleep. Based on research and expert commentary, Table 1 catalogues prevalent factors that may drive your baby to tears.

It also includes critical variables and measurements that can inform prediction and what a recommendation may look like. With additional data over time, we hope to deepen the public’s understanding of factors that result in upset babies and vastly improve the prediction process, which will initially be trained on research. Rather than waking up in a panic, wake up with a plan and know which spoonful of sugar will help your baby go down. In addition to translating your baby’s language, Poppins can track their sleeping patterns to predict what bedtime ritual works to help them sleep through the night. Poppins is a baby monitor that does more than just monitor the problem.

Growing up with Poppins

As your child grows, rather then flying away on an umbrella, Poppins features expand to keep up with your child. Poppins will chart your child’s word development, so you can see its first words, how its word complexity develops, and what curse words it is picking up.  It can also compare your child’s development to national averages, and recommend steps to improve your baby’s language skills. When it comes to discipline, Poppins can try to predict why your child may be acting out, as well as ensuring you are consistent so the child is learning from its behavior, and ensuring you don’t use no too much so when you do, “No” really means something. Poppins can help you raise your child in the most delightful

Image result for baby language over time graph Vocabulary Development

Poppins “Freemium”Model

We plan to monetize Poppins through two channels.  First, we will earn revenue and profit off of sales of the Poppins Smart Baby Monitor Unit. In order to optimize for network effects and improve the performance of our recommendation engine with more data, wide adoption is critical. Accordingly, the unit price of $49.99 will be at the very low-end of the spectrum for smart baby monitors, which retail at up to $2507. This purchase will come with access to a free Basic subscription to the Poppins application for iPhone and Android. Consumers will be able to use the monitor to see and hear their infant, and have access to their own historical data on metrics like number of times the baby woke up per night, the duration of crying, and a score of how restless they were. However, in order to access more advanced features, consumers will have the option to purchase a monthly Premium prescription of $9.99.  The Premium version of the product will perform the in depth analysis of the infant’s crying patterns, tonality, movements, and more, and provide recommendations based on our advanced algorithm.  Given that the Poppins algorithm will improve the more customers and the more data we have to train, exhibiting strong network effects, we believe this “freemium” model is ideal.  We will create a huge amount of value by learning from the large base of Basic Poppins subscribers, and monetize that value by selling advanced features to those who value them the most while still collecting data and improving our engine through non-premium subscribers.

Poppins cares about privacy

We will guarantee our customers that Poppins will never utilize ads, and that we will never sell their data to outside parties.  Though this monetization stream could potentially be lucrative, we think that it is not worth privacy concerns and loss of customer trust. Given the highly sensitive nature of the product, which deals with small children, privacy is a huge potential concern.  By providing an upfront No Advertisement guarantee, we believe that we can help assuage those concerns. Also, generally speaking, baby monitors are already accepted listening devices within homes showing that parents are willing to sacrifice a little privacy for the sake of their child’s safety and comfort.

Poppins Pilot

A convincing Poppins pilot will demonstrate value across two critical dimensions. First, how does our solution impact outcomes for the baby? Second, to what extent do parents feel better equipped to provide appropriate and effective care. We propose a large study (~100 babies and their parents) where one half is treated as a control group and the other half uses a fully functional Poppins Baby Monitor. The control group will also be given the Poppins Baby Monitor but without a working recommendation engine, mimicking the functionality of a standard baby monitor found in the market. After a period of 2 months, we expect to generate a scorecard of critical results – an example can be found in Table 2 below. These results will partially be populated by data collected from the Poppins instruments and partially populated by participating parents on their experiences. We expect to drive positive outcomes as it relates to feelings of anxiety, preparedness, and confidence engaging in child care.

Table 1 – Core Diagnoses, Data Collection, and Recommendations

Reasons Your Baby Is Crying Predictors Solution
Hunger Lip-smacking, sucking on hands, time since last meal Feed the baby
Temperature Ambient temperature Add or remove clothing

Move the blanket

Change the temperature

Nappy change Last meal, last diaper change Change the diaper
Stomach problem, burping, gassy Wriggling, arching back, pumping legs or recently sucked pacifier, hiccupped, cried Bicycle legs and push to chest to relieve gas
Teething Age (4 months old), excess drool, gnawing on objects Pacifier

Massage gums

More stimulation Time since last interaction Automatically plays lullaby
Less stimulation Unfamiliar surroundings, ambient noise, ambient light One-on-one interaction with a trusted loved one
Just need to cry Love, physical comfort Swaddle

It’s okay to let your baby cry


Table 2 – Pilot Scorecard

Pilot Scorecard Control Group Poppins
Populated by Poppins data collection
How often did your baby cry? xxx xxx
How much time did your baby spend crying? xxx xxx – 10% (target)
On average, how long did a parent spend with their crying child xxx xxx – 10% (target)
Survey populated by parent participants

As a parent, rate the following based on how well they describe your experience from 1-10

When my baby cries, I feel confused and stressed xxx xxx – 10% (target)
When my baby cries, I do not know how to respond xxx xxx – 25% (target)
When my baby cries, I feel like my actions address their needs xxx xxx + 25% (target)
When my baby cries, I feel like only my partner is equipped to provide care xxx xxx – 50% (target)

Sources:

1  http://www.pewresearch.org/fact-tank/2010/03/24/parenting-a-priority/

2  https://www.babycenter.com/404_why-does-my-baby-cry-so-much_9942.bc

3  http://www.researchandmarkets.com/reports/3641386/world-baby-monitor-market-opportunities- and

4 http://www.reportsnreports.com/reports/857411-global-baby-monitors-market-2017-2021.html

5 https://www.alliedmarketresearch.com/baby-monitor-market

6 https://www.babycentre.co.uk/a536698/seven-reasons-babies-cry-and-how-to-soothe-them

7 https://www.safety.com/blog/best-smart-nursery-products-and-baby-monitors/


Anecdotal Evidence – SMaRT Pantry: Simple Meals and Recipes Tonight

SMaRT Pantry Makes It Easier to Cook at Home

More and more individuals are looking for solutions to make healthy, home cooked meals easier and cheaper. This growing market—as evidenced by companies like Blue Apron, a recent startup expected to have more than $1 billion in revenue this year [i]—targets those people who shy away from the inconvenience of cooking at home. When asked why they don’t cook, people’s answers range from not having the right ingredients to not being able to cook to not having the time to look for something quick and easy. SMaRT Pantry addresses each of these issues by providing users with recommended recipes that fit their cooking level while using ingredients already on hand.


Machine Learning Techniques Identify Recipes that Fit You

The Simple Meals and Recipes Tonight (SMaRT) Pantry uses machine-learning techniques to provide consumers with access to recipes that meet their flavor, cooking level, and time preferences while strategically choosing ingredients they already have in their refrigerator or pantry. By taking user preferences, data from similar users, and pantry contents, SMaRT Pantry generates customized dinner solutions – it’s like having a personal chef hand-pick every night’s dinner menu.

How it Works

Step 1: Pantry contents (as provided by store receipts or manually entered), favorite recipes, food allergies and dislikes, total cook-time preferences, health and budget desires, and preferred difficulty level are uploaded into the SMaRT Pantry app.

Step 2: SMaRT Pantry uses your historic data (ratings, similar-user preferences, recipe characteristics) and, with state-of-the-art machine learning technology, returns a personalized set of suggested recipes. Depending on your settings, this list may include recipes using only what’s currently found in your pantry, or it may generate a grocery list that allows you to pick up a few key items to execute the perfect recipe.

Step 3: Simply rate your meal to improve future recommendations. With additional use SMaRT Pantry gets better at personalizing recipes for you: providing new ideas and increased meal variety.

The Business of SMaRT Pantry

Initial Development

To prove our concept, we built a beta version of our app. First, we scraped over 10,000 recipes from various online data sources and compiled them into a centralized database. We then simulated user review data to act as a test case for our system—going forward we hope to replace this with actual recipe ratings. Next we built a machine learning algorithm that uses both singular value decomposition and item-based collaborative filtering to predict what a user will rate a given recipe based on their historic review pattern. The goal of these methods is to balance characteristics of recipes (e.g. recipes that are well reviewed in general) with user-specific preferences (e.g. finding similar consumers and using their ratings) to generate a predicted recipe rating. To better test this algorithm, we would need to gather real review data, either by launching our app or partnering with a recipe review platform like allrecipes.com.

Figure 2 shows our beta version of the app, which takes recipes from our database and matches them to users based on a user’s historic ratings. It then combines those predicted ratings with specific meal preferences and outputs a list of potential recipes for tonight.

Phase 1 (Present – 1 Year)

In Phase 1 we will grow a user base to cook and rate SMaRT Pantry’s recommended recipes. Users will benefit from time savings as they will no longer need to scour websites trying to decide on a meal, and with more use they will see that SMaRT Pantry is better able to predict which meals they will enjoy. When SMaRT Pantry reaches 50,000 reviews, the machine learning algorithm will begin to incorporate other user data into recommendations.

Phase 2 (1 Year – 2 Years)

During Phase 2, we will launch additional, paid features. Users will be able to subscribe to the service and begin tracking pantry inventory. Pantry inventory will be managed by having users scan in store receipts, through manual entry of information, and by the record a SMaRT Pantry recipes made. Besides recommending recipes, SMaRT Pantry will be able to use pantry data to recommend grocery lists based on 1) the frequency of typically-purchased items and 2) recipes that would be recommended with the addition of a few supplemental items. Finally, we would also begin to seek advertising revenue from free users.

Phase 3: Additional Features and Partnerships (2 Years +)

Grocery Delivery: Through a partnership with companies like Instacart, a grocery delivery service, SMaRT Pantry can make getting groceries even easier. Users only need to quickly review SMaRT Pantry’s recommended grocery list and through the click of a button have those items delivered within the hour. We anticipate a partner would be willing to pay us a small percentage of all orders placed through SMaRT Pantry.

Push Notifications: Push notifications will provide users with information on what products have been sitting in the pantry for a while and likely need to be used up before reaching their expiration dates. These will also be incorporated into recommended recipes if users note as a preference.

Integration with Other Technology: SMaRT Pantry could even be expanded to incorporate other augmented perception technology. Smart fridges, RFID tags, or other sensors could automatically identify pantry contents, or internet of things appliances could assist in recipe execution, perhaps by preheating the oven or starting a slow cooker in the morning.

Business Model and Funding Ask

The biggest hurdle SMaRT Pantry faces in its initial development is the gathering of user and recipe data. As such, we will begin exploring partnerships with online recipe providers to build a collection of recipes. More importantly, though, in order to be able to provide significant value to users, we estimate that our machine learning algorithms would need at least 50,000 recipe reviews. We estimate that the average user would leave 5 reviews and are assuming a user acquisition cost of about $5 [ii], meaning we require $50,000 for marketing to gather the initial 10,000 users. Beyond that hurdle, we would need about $40,000 for further app development and database hosting.

Once we have our initial set of data and users, we would focus on various avenues of revenue generation: advertising, paid subscriptions, and partnerships (e.g. Instacart). Because there are almost no physical costs to SMaRT Pantry, revenue generated through these methods would go straight to the bottom line, allowing SMaRT Pantry to fund its own continued development. The market for easier, simpler home-cooked meals is huge (larger than $1.5 billion annually [iii]), and SMaRT Pantry can capture a piece of that market at extremely low costs.


Technology vs. Human: SMaRT Pantry Has Us Beat

To demonstrate the effectiveness of SMaRT Pantry to a broader audience (between Phases 2 and 3), we propose a cooking challenge in which the target consumer provides information on her favorite recipes, allergies, and preferences to a professional personal chef. This chef, using a typical pantry, picks a recipe and prepares a meal for her. SMaRT Pantry takes the same information as the chef and, using its database of other users and user preferences, selects a recipe. A second professional chef will prepare this meal. The outcome? Our target customer tastes both meals and sees that SMaRT pantry is better able to predict what she likes. In other words, SMaRT Pantry is better than a personal chef picking your menu every night! The bonus, of course, is that she can use SMaRT Pantry herself and pick a recipe in a fraction of the time that it would usually take.

We could pilot this demonstration either directly for potential partners (showing them the value of this product) or to random potential customers. We could then use those results in advertising, showing testimonials where new users rave about how much the SMaRT Pantry understands their preferences. Our marketing could then be based around the idea of “having a personal chef pick your menu every night.” This gets to the core technology of the system—the data-based approach to choosing a meal that fits every individual’s needs and wants.


Sources

[i] https://www.recode.net/2016/10/2/13135112/blue-apron-revenue-run-rate-billion-ipo

[ii] https://fiksu.com/resources/mobile-cost-indexes/

[iii] https://www.eater.com/2016/5/20/11691446/meal-delivery-blue-apron-plated-hello-fresh-marley-spoon

Final pitch sumbission: Engauge (Teamwork makes the dreamwork)

Problem:

Engauge is a product suite that provides real time feedback on engagement in order to optimize messaging for the target audience. Initially, Engauge will be focused on the education sector with broader future applications in areas such as live entertainment, television, and movies. Studies have shown that students with teachers that “make them feel excited about the future” and a school that “is committed to building the strengths of each student” are 30 times more likely to show engagement in the classroom than students who do not agreement with these statements. (source: http://www.edweek.org/ew/articles/2014/04/09/28gallup.h33.html). According to a report by Gallup education, engagement in the classroom is the key predictor of academic success. Students often have short attention spans and keeping them consistently engaged is a challenging endeavor. Unfortunately, current solutions that measure engagement rely on surveys and student feedback which are not done in real time and can often be extremely inaccurate. The Engauge solution will not only provide more accurate feedback that doesn’t rely on subjective measures, but will also provide this data in real time to teachers. This will allow teachers to adjust on the fly when engagement is slipping in order to ensure that students remain consistently engaged. Engauge will accomplish this by utilizing advanced real-time image and sound processing technology on an individual level.


The education sector represents a huge opportunity as represented by the massive scale of private schools within the US. Private school revenue totals $56.7 billion and it is estimated that 5.4 million students attend close to 34,000 private schools with average annual tuition of $13,640 ($22,440 excluding non-sectarian schools). Private schools are continually innovating to attract parents who are willing to pay a large annual fee so that their children can receive a superior education. Engauge will provide private schools with a significant advantage as they will be able to utilize the solution to maximize engagement and utilize analytics to continually improve their teaching methods and subject matter.


Solution:

Engauge will utilize advanced real-time image and sound processing technology to measure audience engagement in a variety of contexts. Our initial focus will be on the education sector. Some of the classroom use cases we are most excited about include:

  • Diagnostic tool to understand key gaps in material and delivery
  • Student-specific trend analysis to identify at-risk students early on
  • Course-correct in real-time as students start to lose interest
  • Individualized career counseling based on material that most piques each student’s interest


The technology that allows us to deliver these powerful insights is driven by a Convolutional Neural Network for both image recognition and natural language processing. The CNN model will collect a number of key inputs into our model:

  1. Image:
    1. Identity of student
    2. Facial expression
    3. Eye focus (i.e. where they are looking)
    4. Body posture
    5. Body movements (e.g. fidgeting)
  2. Audio:
    1. Tone
    2. Emphasis
    3. Topic / content
    4. Lesson type


By pairing the visual data with the audio data, we can deliver powerful insights on how students are engaging with a teacher’s material. The set-up is extremely simple – all that is required is to set up our plug-and-play video camera at the front of your class. Engauge will be a completely SaaS platform, so the feed from the camera will automatically be sent through our algorithms and the output and analysis will be communicated in real-time.


More detail on CNN:

There are 4 main operations in the CNN:

    1. Convolution: Extract features from the image


  • Non-linearity: Real-world data is non-linear, so model include those elements
  • Pooling: Make input representations smaller and more manageable
  • Classification: Classify different components of an image


Pilot plan:

To apply and demonstrate this new technology, Engauge will initially target K-12 private schools. We believe private schools are the best initial target for Engauge, given how critical student engagement is to academic success. Private schools in particular have the resources to implement the technology and interpret results. They will also be more open to adjusting teaching methods to improve overall engagement levels. Once adopted, we believe parents will be interested in the information as well, and will use this data as a way of comparing potential schools in which to enroll their children.

We intend to pilot Engauge at The University of Chicago Lab School. This school in particular is a perfect playground to launch Engauge, as teachers and parents alike are interested in new technology and will be eager to analyze new data. Engauge monitors will be randomly placed in 50% of Lab School classrooms. Teachers and students will not know which classrooms have Engauge technology installed. For one week, teachers will be asked to fill out a brief survey after each class that assess student engagement. Survey questions will include:

  • What topic was discussed in today’s class?
  • In chronological order, what activities occurred (lecture, discussion, etc.)?
  • On a scale of 1 to 5, how engaged were students in today’s class?
  • What part of class did students find most compelling (and what time did this occur)?
  • What part of class did students find least compelling (and what time did this occur)?


Over the pilot week, we will aggregate data from each grade and compare survey results to Engauge metrics. We believe Engauge will be able to more accurately pinpoint levels of engagement in each class and throughout the school day. Data will reveal which teaching methods worked in keeping students engaged in the subject, and which methods were not as well received. It will also show which teachers have overall higher and lower engagement levels, and also identify specific children that have downward trending engagement.

We believe that overtime, Engauge will be a predictor of test scores and student satisfaction levels. Teachers will be able to improve their teaching methods, as well as experiment with new ways to keep students excited. Principals will be able to use Engauge data in aggregate to assess how well the school is doing as a whole. They will be able to assess which teachers are engaging their students best, and which subjects generate more student excitement. This technology provides a way of assessing new hires and monitor teachers that may be struggling. It will also allow schools to identify at-risk students that are losing interest earlier, and help them get back on the right track with tailored help based on engagement data.


Overall, Engauge will equip private schools with better information on how their teachers and students are performing. This technology will promote student participation, which has been shown to lead to better test scores and graduation rates. As Engauge’s algorithm strengthens which each class, we will be able to adapt the technology in other for-profit sectors, as well as public schools that will benefit even more from this data.


Funding ask:

We are asking for $90k to fund this pilot with the University of Chicago Lab School. Our technology is already built and ready to be tested in a classroom setting. We believe this pilot will give us the data and insights to launch Engauge to the next level.

Shallow Blue: Pacemaker Predictive Analytics

Our solution predicts when someone with a pacemaker/ICD is about to experience cardiac arrest, so that a physician can appropriately intervene ahead of time and save the patient from the discomfort and harm of receiving a shock from the pacemaker. We are requesting $250,000 to help fund the upfront clinical trial and proof of concept phase, at which point we will need additional funding to commercialize and scale the product.


Background on the Problem

The global pacemaker market is expected to reach $12.3 billion by 2025, and each year 1 million pacemakers are implanted worldwide. A pacemaker is a small, battery-operated device that is usually placed in the chest to treat arrhythmias, or abnormal heart rhythms. It uses low-energy, electrical pulses to prompt the heart to beat at a normal rate. A similar device called Implantable cardioverter defibrillators (ICDs) can prevent sudden cardiac arrest. There are also new-generation devices that combine both functions.

Pacemaker


Although pacemakers and ICDs can deliver lifesaving therapy, they are not always accurate; up to one-third of patients get shocked even when they should not be. This potentially leads to adverse health outcomes, as some trials suggest a strong association between shocks and increased mortality in ICD recipients. Thus, there is a real patient need for a solution that identifies and prevents cardiac arrest even before it happens. Identifying patients at risk can prevent shocks, hospitalizations, and even death, and can also generate quantifiable cost savings: a Stanford study suggests $210 million in Medicare savings could be achieved by introducing this type of technology.


Description of the Solution

We propose the development of an analytics dashboard for physicians that uses machine-learning algorithms in combination with remote monitoring data collected from the patient’s pacemaker to identify a patient’s risk for cardiac arrest. The algorithm will employ supervised learning as it will initially be trained on de-identified data from patients who have been correctly shocked in the past. This data is already being collected from remote monitoring systems, which collect hundreds of data points each and every minute spanning across 60+ physiologic variables such as heart rate, activity level, fluid backup, and variability in EKG findings. Through an initial pilot study, we found that a number of these variables change in the hours and days leading up to a shock; see the figure below for what a life-threatening cardiac arrest looks like for a device right before it delivers therapy.

What the moments leading up to a shock look like on a device

Our dashboard would essentially build a layer of analytics on top of the existing ICD logic that will improve the accuracy of the shocks and alert physicians and care teams when certain changes in variables might indicate that a patient is at risk of cardiac arrest. The model will be based on neural networks combined with a support vector model that can relate patients in real time with those that have received a shock in the past. See the figure below for an example dashboard interface, with the tile in the bottom left corner alerting the physician to the patient’s risk level.

Sample dashboard interface

Once a patient has been identified to be at risk for impending shock by our dashboard, the care team can provide preventative care. This can include a) medical management (diuresis, antiarrhythmic medications, or hemodynamic monitoring) to prevent further clinical decompensation into cardiac arrest requiring device therapy or b) reprogram the device parameters to prevent inappropriate therapy. Through this “human-in-the-loop” intervention, the algorithm can learn to better risk-stratify patients in need of therapy.

For the second version of our product, we will directly integrate our solution into the medical device itself. By doing so, our solution can provide real-time analysis rather than waiting for home-monitoring data transmission. This vertical integration will be first-in-class and provide an advantage over potential new-entrants who seek to develop a cloud-based solution modeled after our initial solution.

We plan to license our software to medical providers so that they can provide higher-quality care to patients with pacemaker/ICD devices. With a changing reimbursement environment that links financial reimbursement with medical outcomes, we believe that physicians and hospitals will be incentivized to pay an ongoing premium to use the software.


Empirical Demonstration

We will design a prospective randomized control trial that will randomize patients into either a control group or a treatment group. Each patient will be assigned a risk score by our algorithm. The control group will continue to use their pacemaker/ICD as is, while the treatment group will receive additional preventative warnings generated by our algorithm that will alert them to seek immediate help from a physician. We will measure and compare 1) the total number of shocks delivered; 2) the proportion of shocks that are inaccurately delivered; and 3) the number of “interventions” from our algorithm that resulted from a real, elevated measure of patient risk, as ascertained by the physician. A successful outcome for this demonstration would be an overall reduction in the total number of shocks on a risk-adjusted basis (measure 1), a reduction in the “false negative” rate (measure 2), and a low overall “false positive” rate (as extrapolated from measure 3).


Pilot

We conducted a pilot study of over 2,500 patients and found that several key variables change prior to shock. The first graph below shows the elevation in heart rate prior to shock. The second graph on shows the predictive value of this variable in a univariate regression analysis. As you can see, heart rate on its own already seems to be a fairly good predictor of a shock. We then ran a logistic regression on all 60+ variables to identify multivariate correlations. See the figure below for the results of that model.

Univariate regression analysis (using heart rate)

We plan to expand our algorithm development beyond this initial feasibility study to include analytical methods borrowing from techniques such as “data-smashing” and “hawkes processes” that provide advanced insight into continuously acquired quantitative data streams. The advantages to these methods is that they can infer causal dependence between streams with a relatively small dataset (as compared to a neural network, for example). Beyond the statistical advantages these methods convey, the relatively minimal computational power required provides an added advantage of being incorporated into the pacemaker itself.

Multiple regression analysis

After finalizing the first version of the algorithm, we will partner with the University of Chicago Medical Center to launch a pilot prospective research study for patients with pacemakers who receive care at the University. Our algorithm and dashboard will be embedded into the workflow of the arrhythmia care provided to patients with pacemakers to identify potential corrective therapy before an arrhythmia occurs. Upon demonstrating the success of the product at the University of Chicago, we will move from the pilot phase into the full launch of our licensed software to other tertiary referral academic medical centers. We will also explore joint-development with device manufacturers as they have a strategic interest in improving their product through advanced analytics.