
A Guide to the Ashkelon Volume 7, Iron Age I Web Map
View Ashkelon Volume 7, Iron Age I Map
This is a User Guide to the Ashkelon Volume 7, Iron Age I Web App. Geospatial data for the Iron I period, focusing on Grid 38 at Ashkelon, is presented as an interactive web map where the user can explore architecture, material culture, and faunal remains.
[For more published Ashkelon data for other periods and volumes, see the Ashkelon publication web page.]
Main Features
When the application first opens the default view will be displayed. This consists of the Grid 38 basement. The layer list window will be open with all the layers turned off.
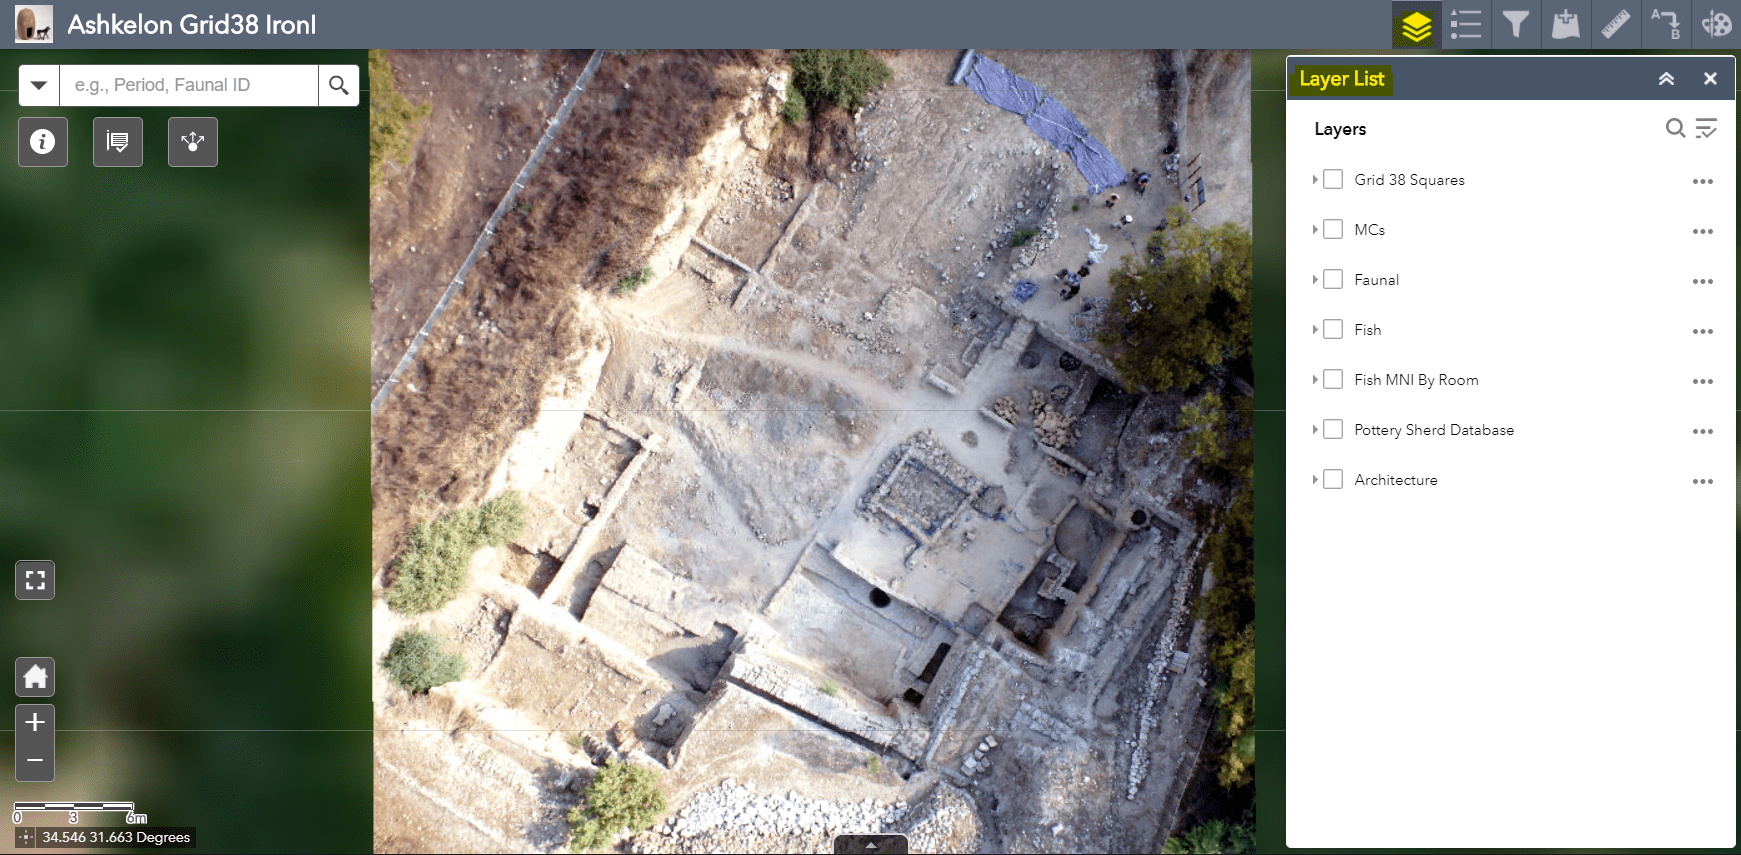
Default view, Grid 38
The top navigation bar at the top right of the application are the primary tools for interacting with the data. The icons from left to right are: Layer list, Legend, Filter, Add data, Measure, Distance and Draw.

Navigation bar
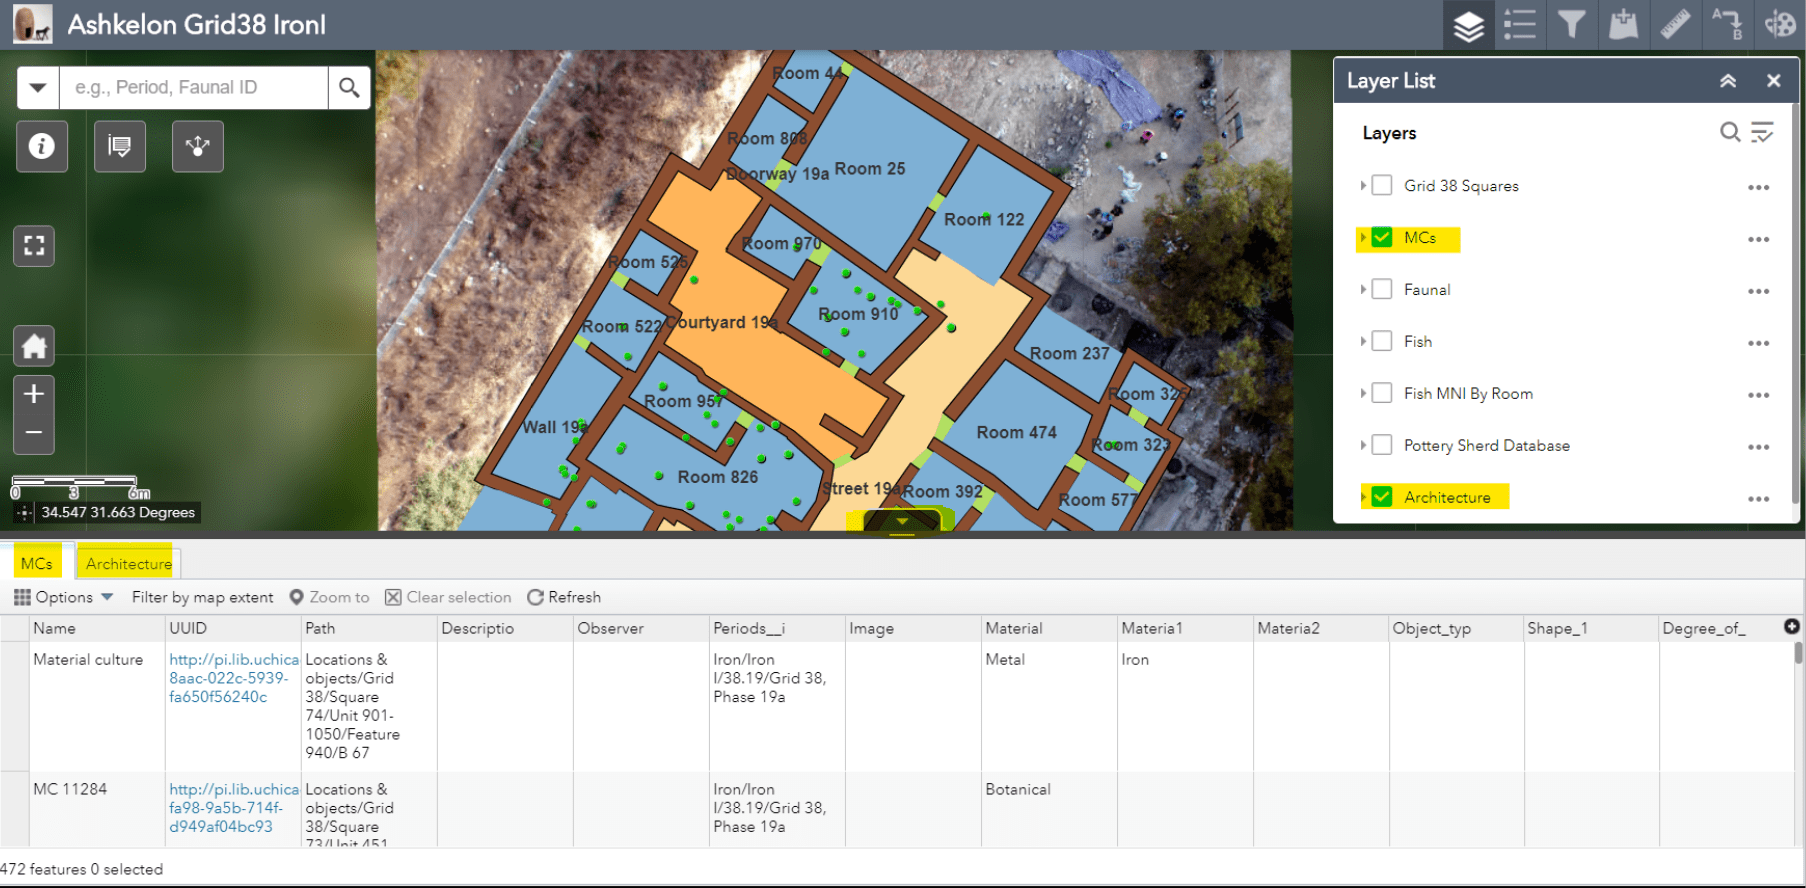
Layer list contains the main data sets available in this application. A layer must be turned on for its data to be displayed. Layers by default display available data unless a filter is active.

Architecture layer turned on
Legend displays a color-coded key for all of the activated layers.
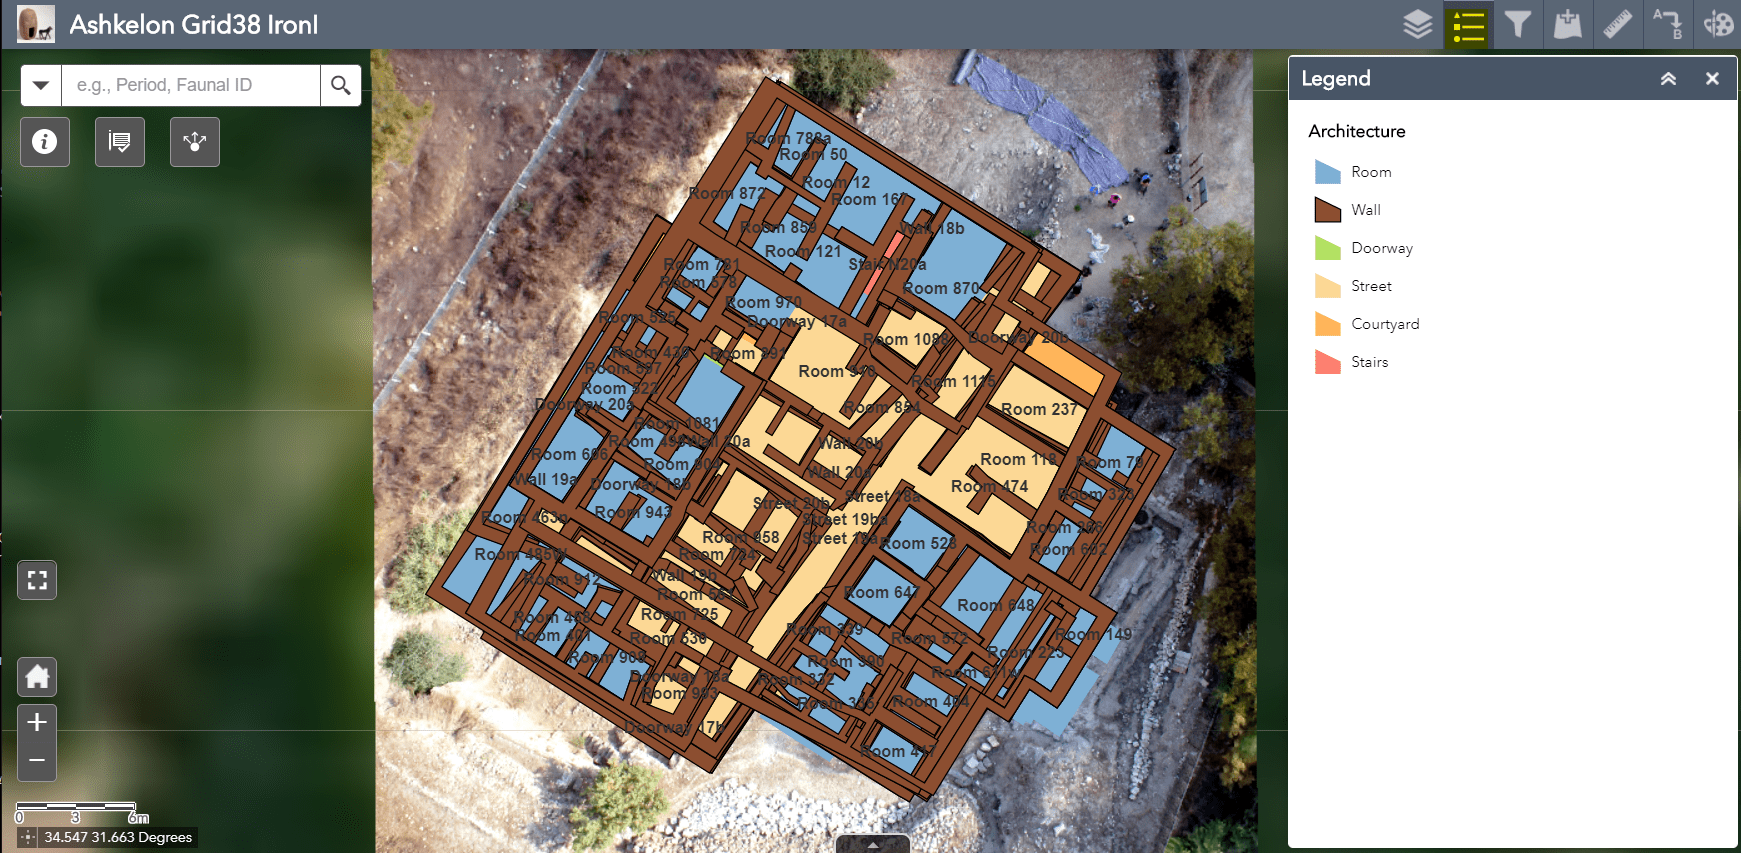
Legend for the architectural layer
Filter contains premade constraints for each layer. In order to activate a filter a value needs to be selected and it must be toggled on.

This filter displays MC Type = Blade and Architectural Period = 19a. Architectural periods are located at the bottom of the filter list.
- If a filter is toggled on and nothing displays make sure the layer is turned on in the layer list window.
- Filters for each layer constrain each other. For example, if the MC period filter equals 19a then the only values available in the MC types picklist will be period 19a items.
- Architecture almost always needs to be constrained by period in order for there to be a coherent layout.
- Currently there is not a global filter feature that constrains all layers at once. When filtering data such as period each layer must be constrained individually.
Add data allows a user to add their own or additional data layers to the application.
Measure allows a user to calculate the distance or area on the map.
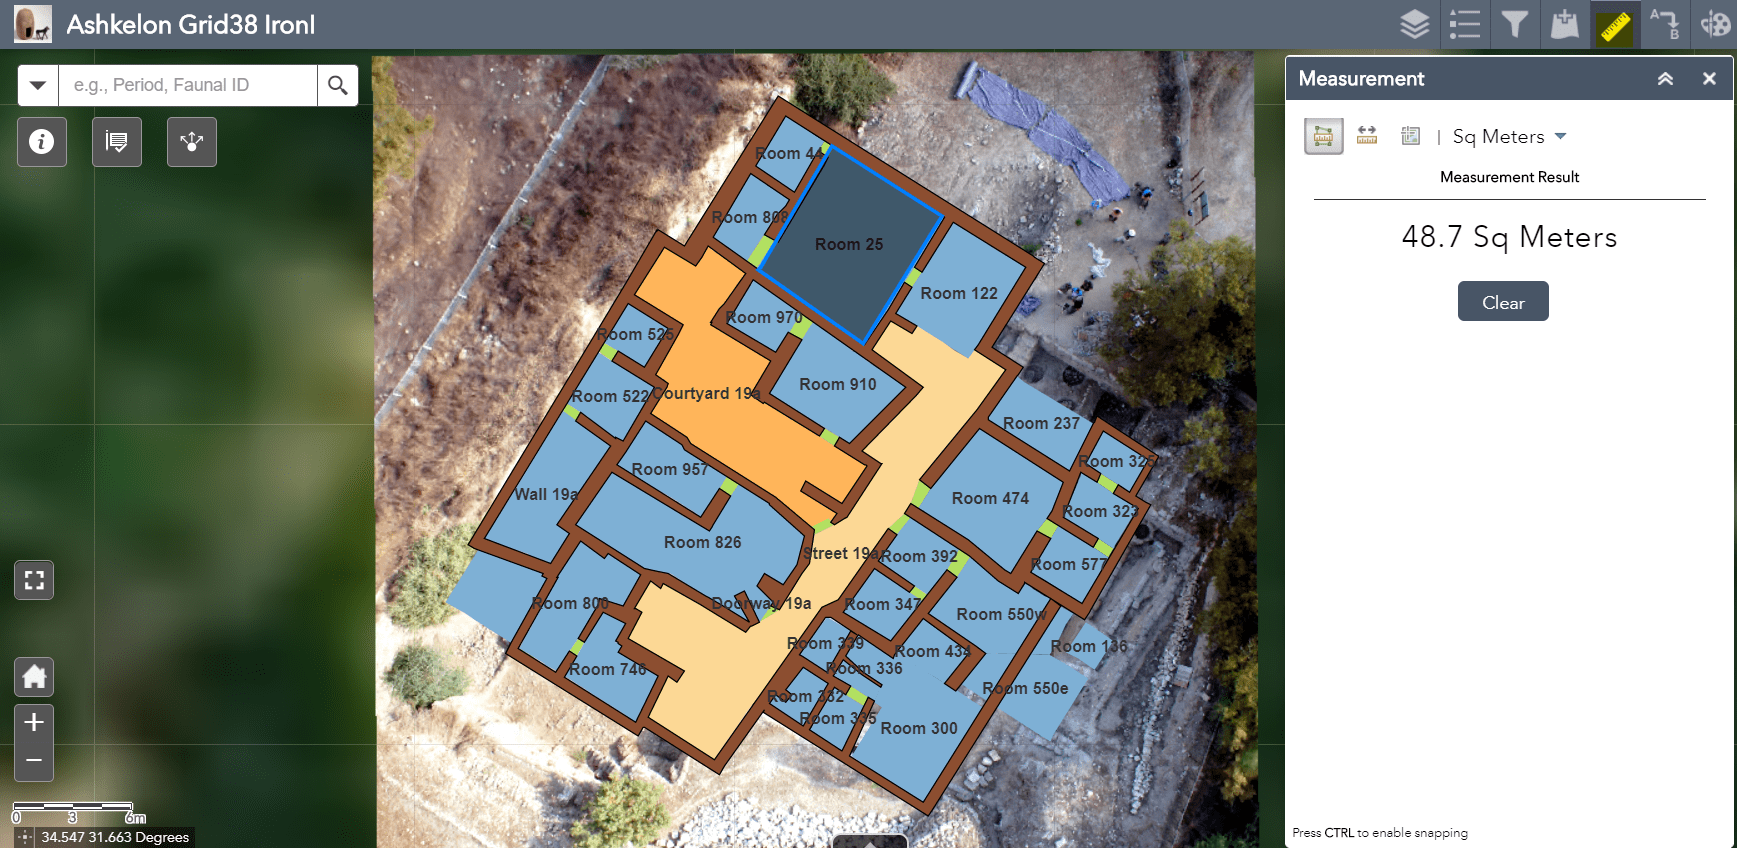
Calculating the square meters of Room 25
Distance provides additional measurement tools.
Draw allows a user to add annotations to the map.
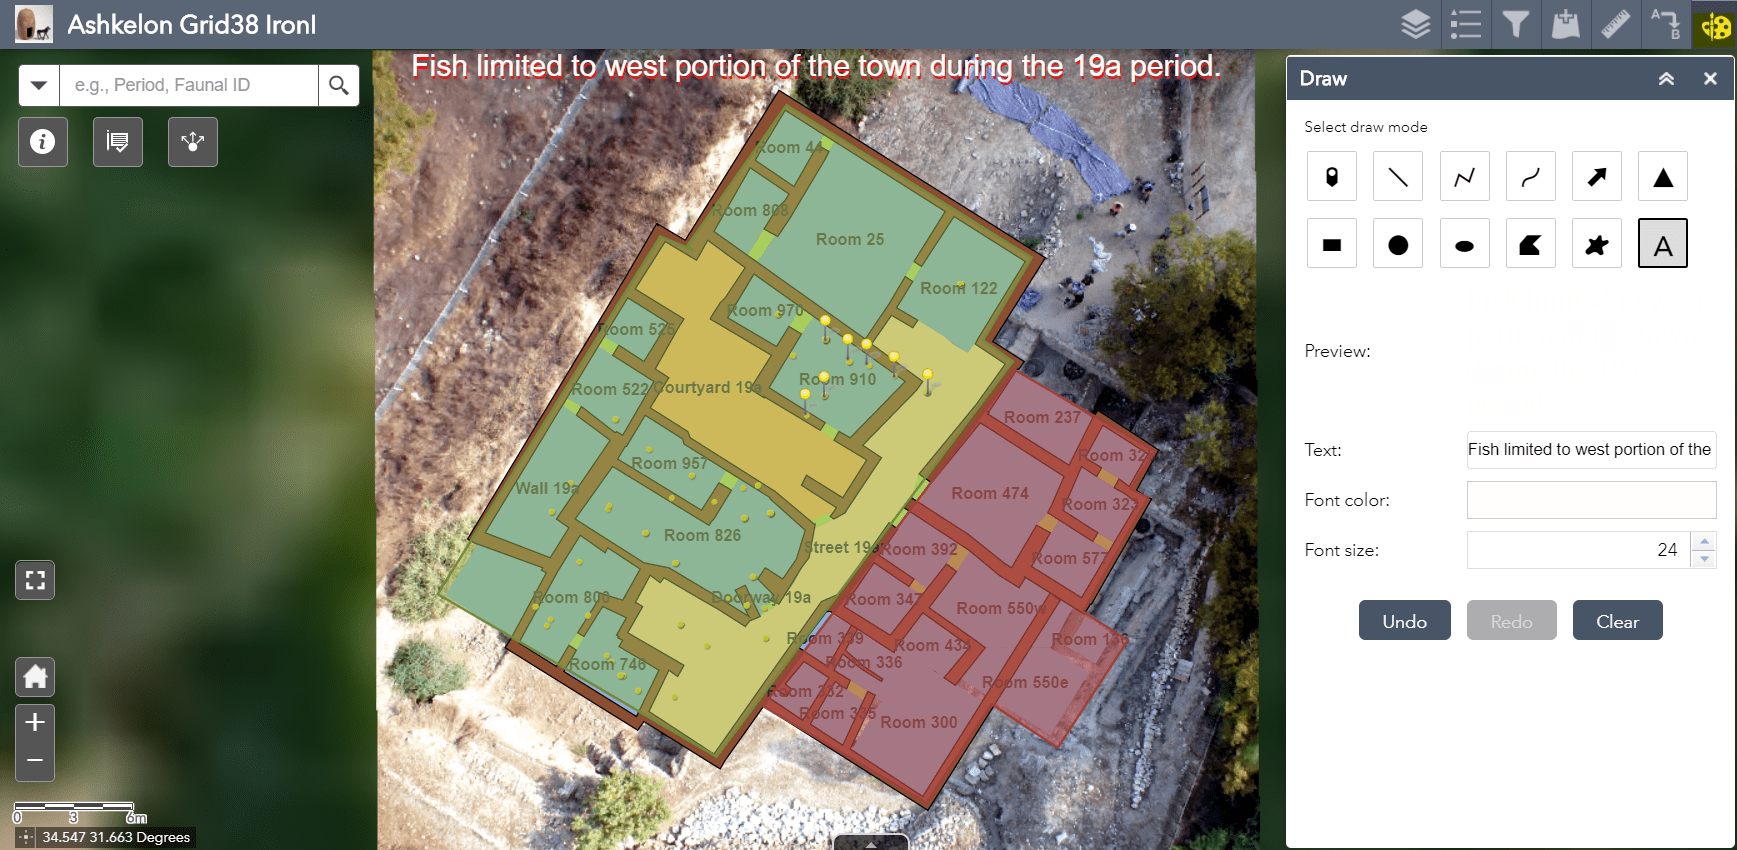
Adding custom annotations to the map, here a title
Attribute Tables
The Attribute table tab at the bottom center of the application allows access to the data tables that are behind the visual display.
Viewing the attribute tables
The tables displayed in the attribute table window synchronize with the layers list as layers are activated and deactivated. If a filter in the navigation bar is active the data results in the attribute table will also be filtered. A user can create new filters by selecting Filter in the options menu of the attribute table pane.
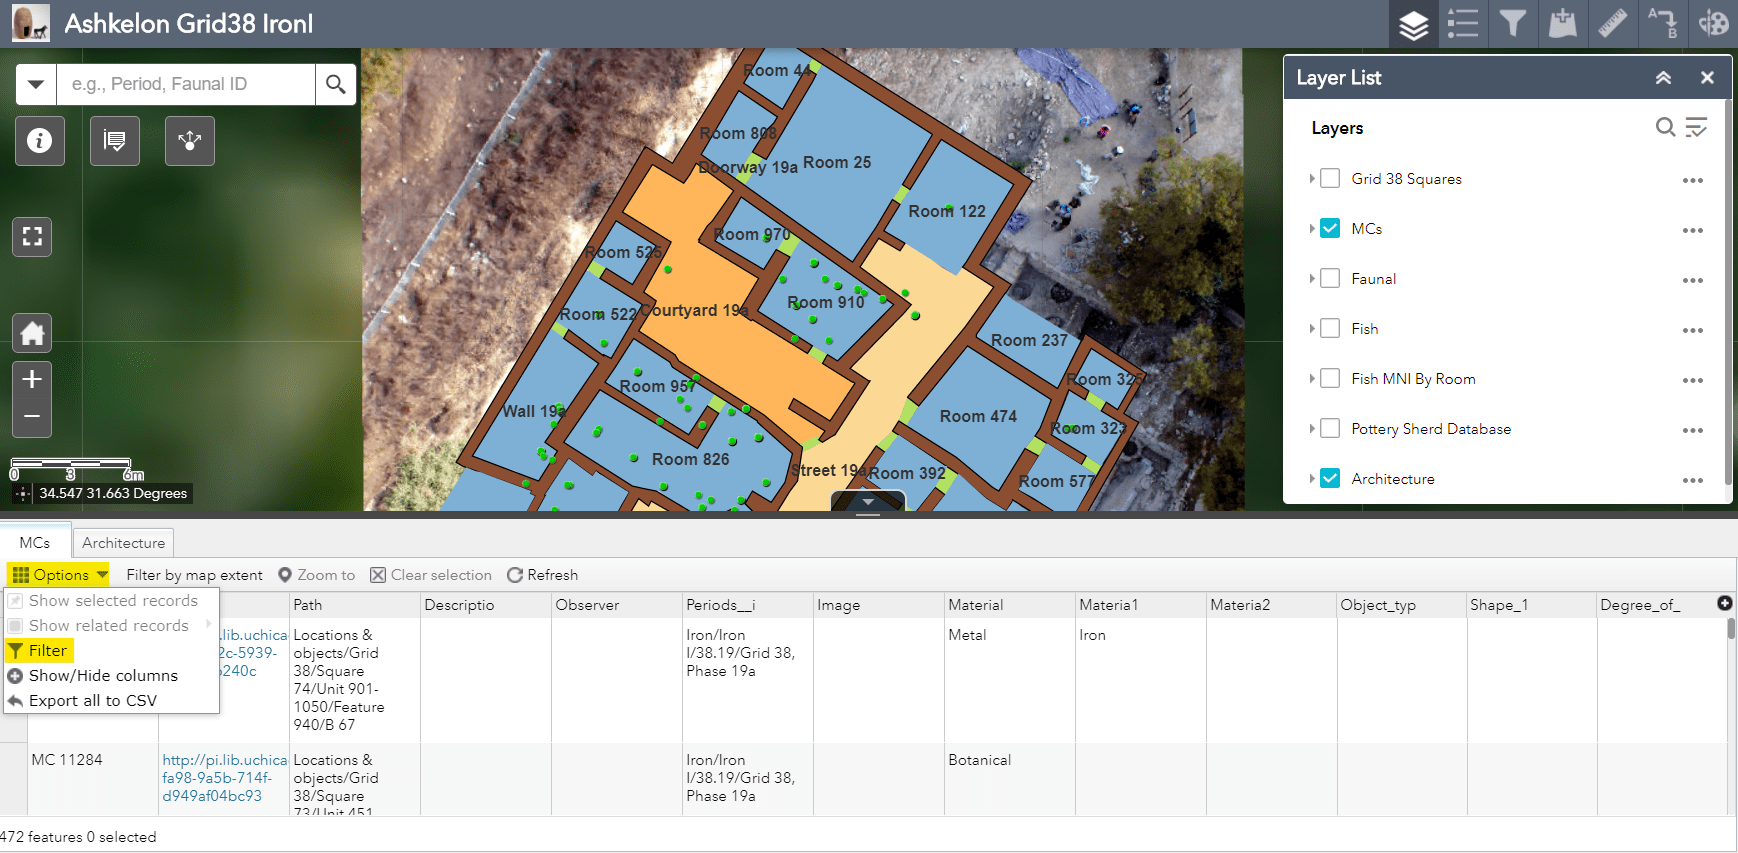
Filtering the attribute table
The data in the attribute tables can be exported by selecting Export all to CSV in the options menu.
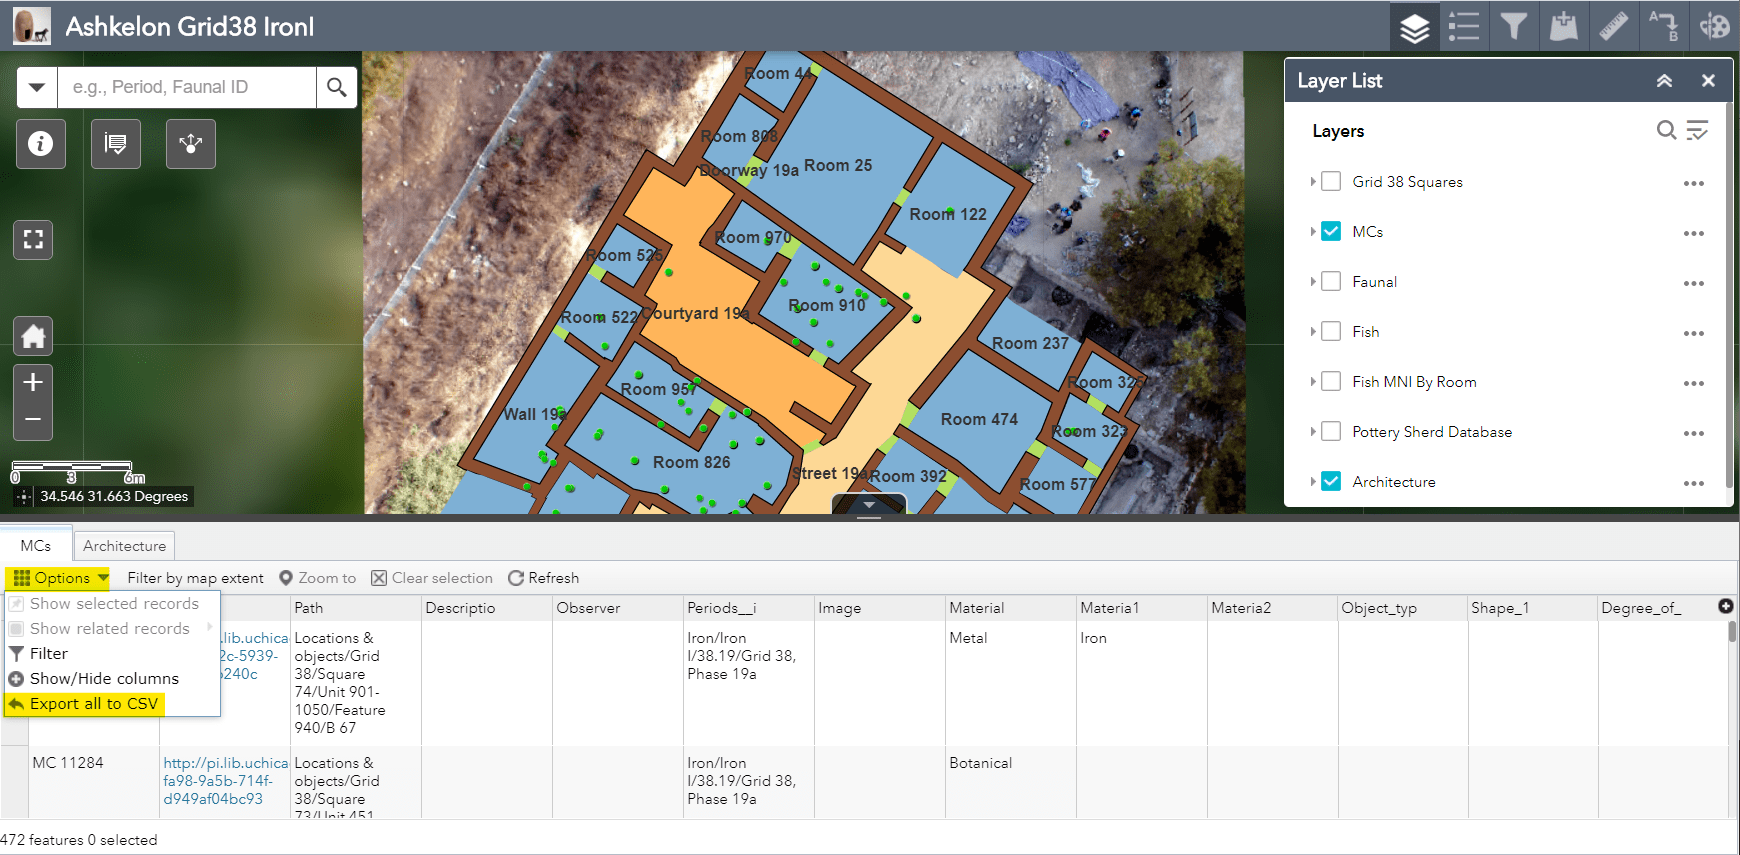
Exporting attribute table data to CSV
Search and Display
The Search bar in the upper left side of the application allows for searching globally or by layer. By default the search is set to all (or global). Individual layers can be selected by clicking on the dropdown arrow.
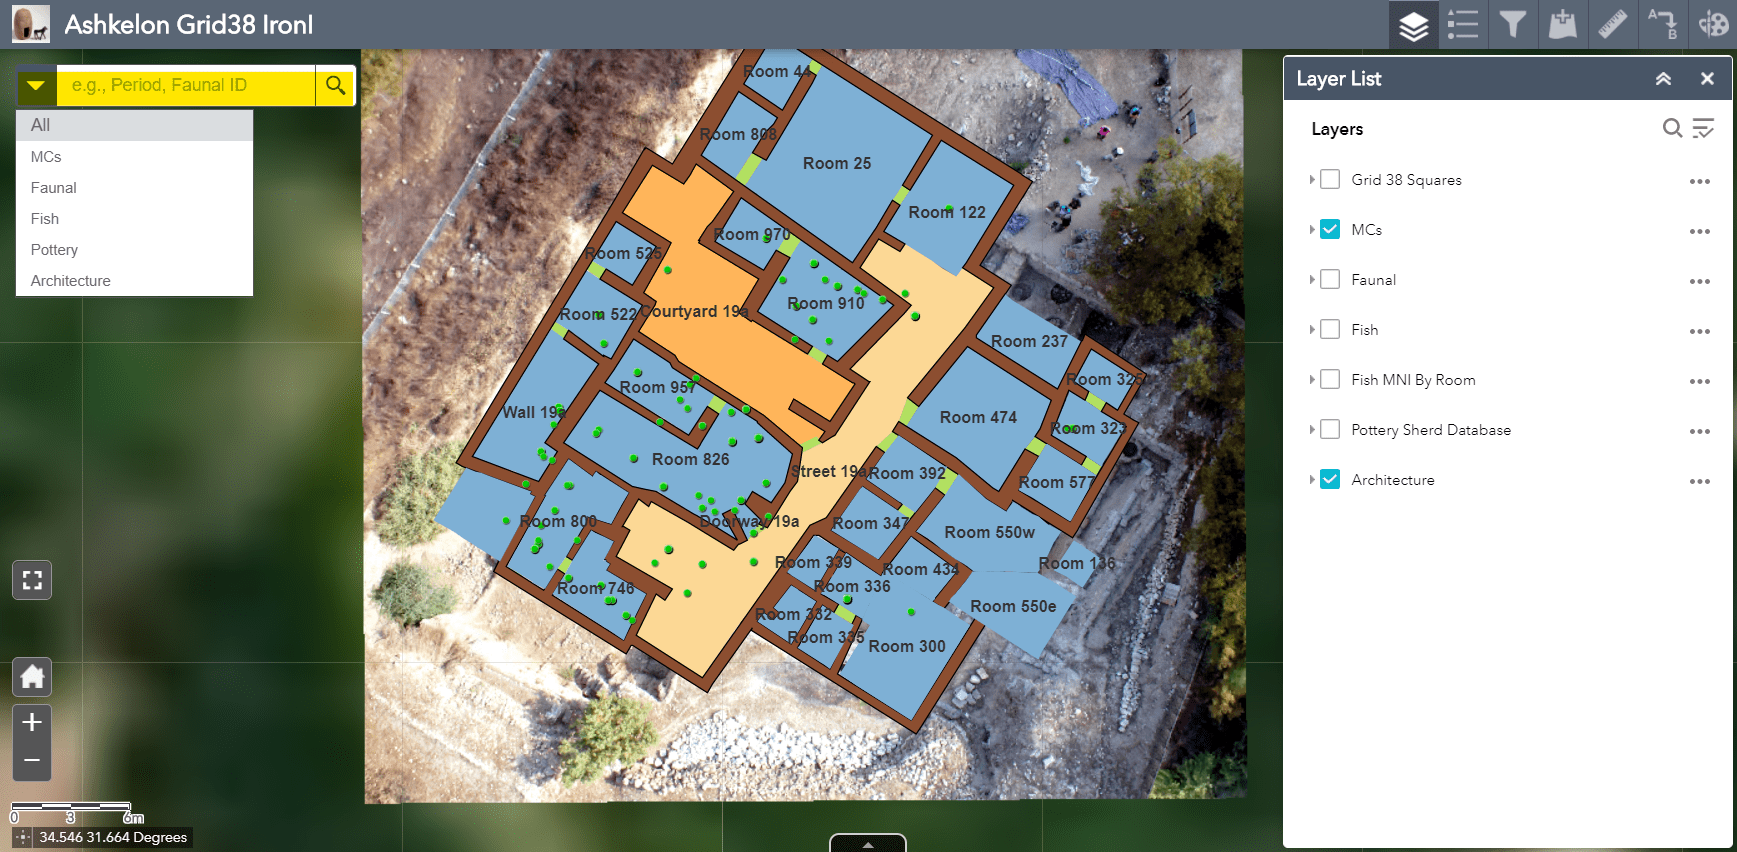
Search bar
The Search bar is a great way to find a specific item and see its context. Click the item to view its pop-up window of additional information.
The triple dot icon at the bottom right of a pop-up contains the additional options of: Pan to, Add a marker, and View in attribute table.
The “More info” link is a permanent citation URL that will take a user to the item’s full database record, published on the web.

Search bar: An MC search for “MC 56189”
Additional Widgets
The floating widgets at the top left side of the application are: About, Report, and Share.
The About icon has additional information about the project and the link to Ashkelon’s web publication page which presents a vast network of published data.
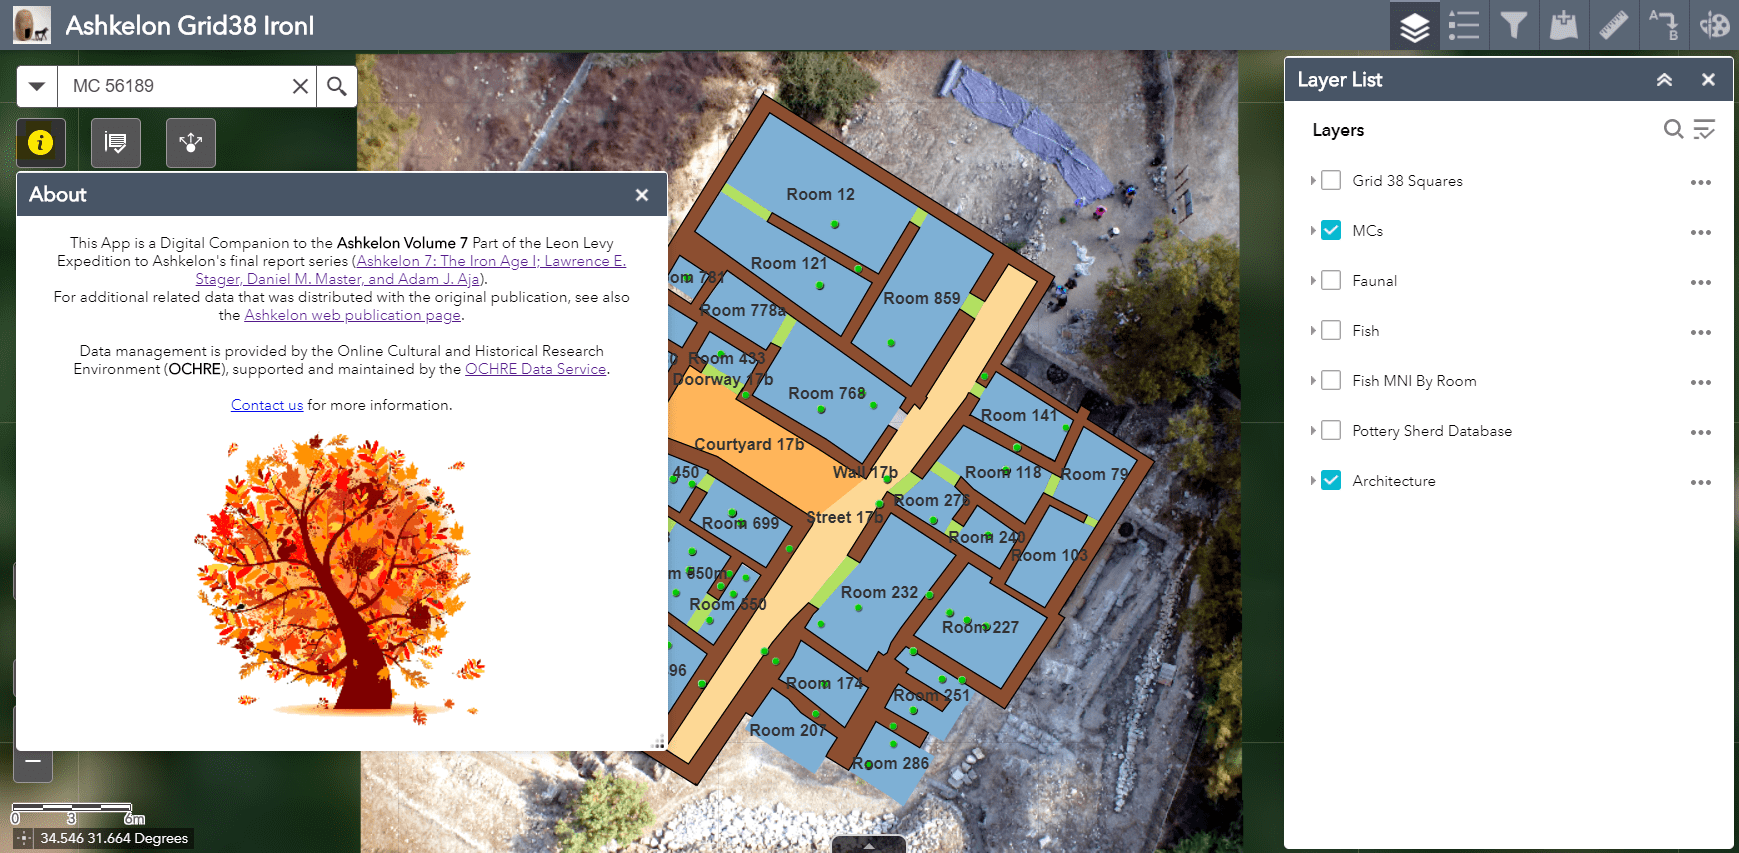
About the application
Share provides options for easy sharing of the application and data through email and social media.
Acknowledgments
Project data is managed by the OCHRE platform and supported by the OCHRE Data Service at the University of Chicago.
Special thanks to Technology Specialist Nicholas Z. Schulte who prepared the data for this publication platform, developed the web app using the ArcGIS Online environment, and wrote this User Guide.