- Is the weather good for observing?
- How do I find objects to observe or what’s up in the sky right now?
- Check: Have you requested time?
- What tools do I need to observe with SEO?
- #ixchel: May the Mayan goddess of the moon be with you
- It’s time to crack open the dome!
- So…sleepy…time to go to bed💤
- I’ve taken a lot of images! How do I download them?
- Now that I have images, can I look at them?
So you’ve decided that you want to take the leap and begin observing with Stone Edge–hooray! I assure you, this will be a lot of fun. Let’s first start with the most important question that is the bane of all astronomers:
Is the weather good for observing?
Given that our telescope is in a vineyard in Sonoma, California, unfortunately we don’t always get the best weather conditions unlike for example telescopes on the mountains of Chile. It’s very important that you look at the weather beforehand (and not just the cloud cover!) so that you don’t spend an evening observing and then get images with low quality due to atmospheric conditions.
Ok…but where do you check this? Usual weather apps like weather.com or Google weather really only show the temperature, humidity, and if it’s clear, cloudy, or raining. And unlike other major observatories, we don’t have a suite of instruments to measure atmospheric conditions around the observatory, but there are some great free tools you can use online!
Our go-to is using Clear Dark Sky charts: http://www.cleardarksky.com/csk/. If you scroll down to where it says “By Keyword” under the red “Search” menu and enter in “Sonoma”, it will pop up a list of charts for locations near Sonoma. Click on the one that is just titled “Sonoma”.
Boy, those are a lot of little colorful squares! It might look intimidating at first, but once you learn to read this chart you’ll be able to tell at a glance whether or not opening the dome is a good idea on any particular night. There is a key to what all of the colors and rows mean below the chart, but I’ll give you a quick crash course here as well. Let’s take a look at the chart for the next coming days:
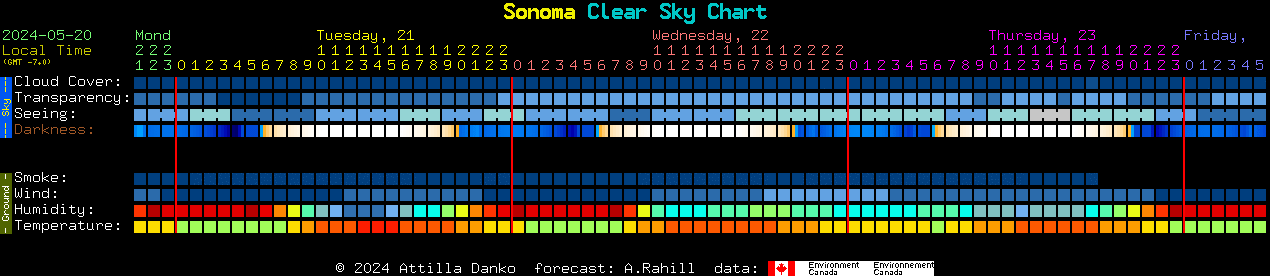
Each row shows a different sky or atmospheric condition. You read the chart from left to right, and the time (in 24-hour format) is written at the top of each column. It shows the local time, i.e. in Sonoma, so make sure you account for any time difference you may have. Let’s look at each row individually:
Cloud Cover
This is pretty straightforward: how cloudy is it? The lighter/whiter the square, the cloudier it is. You want these to be as dark blue as possible during your observing run.
Transparency
This basically shows how much water vapor is in the air, i.e. how opaque is the air between the ground to the atmosphere. If it’s a really humid summer day or air pollution is bad, the transparency will be lower and makes it harder to observe faint, lower surface brightness objects like nebulae. Like cloud cover, you want these square to be as dark blue as possible.
Seeing
This metric measures how turbulent the atmosphere is and tells us how stable the sky is. If the seeing is bad, objects like planets will look like they are underwater and the image will look distorted. Ironically, when we say that the stars are “twinkling”, this is actually a bad sign! We want stars and planets to look as still as possible, and you want your seeing squares to also be as dark blue as possible.
Darkness
This row simply tells us how dark the sky is, assuming a clear, unpolluted sky. Ideally, you’d want these to be as dark as possible, but that usually never happens in reality. The color also depends on the strength of the moonlight: if there’s a full moon, the sky will be washed out and the chart will be a lighter blue. Any colors lighter (orange-white) are times between twilights when the sun is above the horizon.
Smoke
Since the devastating 2020 California wildfires, the author of this chart has added a row for how much smoke is in the air due to wildfire. Blue means no smoke, brown/black is medium, and red is very high amounts of smoke (dangerous not only for telescopes but people as well!). This row is not yet 100% calibrated, so double check with the NOAA smoke map to make sure your observations won’t be hampered by this.
Wind
This tells you how windy it is. Darker blue is light (0 to 5 mph is the darkest), all the way up to white (>45 mph, VERY windy). It’s best not to observe during really windy conditions as this can also reduce your image quality.
Humidity
This tells us how much moisture is in the air. It’s best not to observe during very humid nights as not only does this ruin the transparency, it can also cause condensation to start building up on a telescope’s mirror. Dark blue is the best (<25% humidity), going all the way up to red for very humid nights.
Temperature
This is the same temperature as any weather website would tell you. Grey or red blocks indicate very hot or warm weather, all the way down to blue and pink for freezing temperatures. Luckily for us, Sonoma is usually pretty temperate and we shouldn’t have to worry about it being too cold to open the dome.
Take some time to look at the most recent chart and get accustomed to reading the colors and evaluating whether a particular night is good or bad for observing. Sometimes there’s not a strict cutoff–bad seeing or transparency doesn’t mean you physically can’t observe, but it will mean your images will be of poorer quality, so it’s best to chose another night if you care about that.
If you ever want more information about a particular square in the chart, you can hover over them and it will pop up a tooltip with more precise numerical information. This is easier than scrolling down to read the color legends below the chart.
Note: The chart is not updated constantly (usually only twice a day or so), and in a few cases the weather conditions might change since it was last updated. Always cross-check your weather with another source (like #ixchel, scroll down to read more about it) to make sure you’re a go for the night.
How do I find objects to observe or what’s up in the sky right now?
Before we look at observation-planning software, it’s first important to know what limitations SEO has and what kind of objects it can successfully observe. SEO is a 20-inch (0.5 meter) telescope. This means that it can’t observe really faint or low surface brightness objects because these are just too dim for the scope to gather enough light. A good rule-of-thumb is that objects of magnitude 16 and brighter are fair game, anything fainter is going to be hard to see. This is not always going to be true: objects that have a brighter magnitude but a very low surface brightness can also be hard to detect.
The other factors to take into account are sun altitude and the coordinates of your potential targets:
- The sun should be below -18 degrees in altitude to get good quality images that are not hindered by the last dregs of twilight, though you can usually start opening the dome around -15 degrees to get the night started and make sure the telescope and camera are functioning properly. This rule really only matters if you are trying to observe an object that gets low on the horizon during dusk or dawn.
- Your object should be between -80 and +80 Hour Angle.
- If possible, it’s best to observe objects when they are the highest in the sky so that you are looking through less atmosphere (astronomers call this looking through less airmass). That said, any objects you observe must be at least 30 degrees in altitude or higher. Any lower, and the telescope can start having problems pointing properly or get out of balance. Please always be aware of how high your objects are in the sky, especially if you begin a long imaging sequence when your object is getting close to this limit.
That might sound like a lot to keep track of, but luckily there are lots of tools and apps out there that you can use to plan observations or find observing inspiration! I’m going to highlight two main ones here:
Stellarium
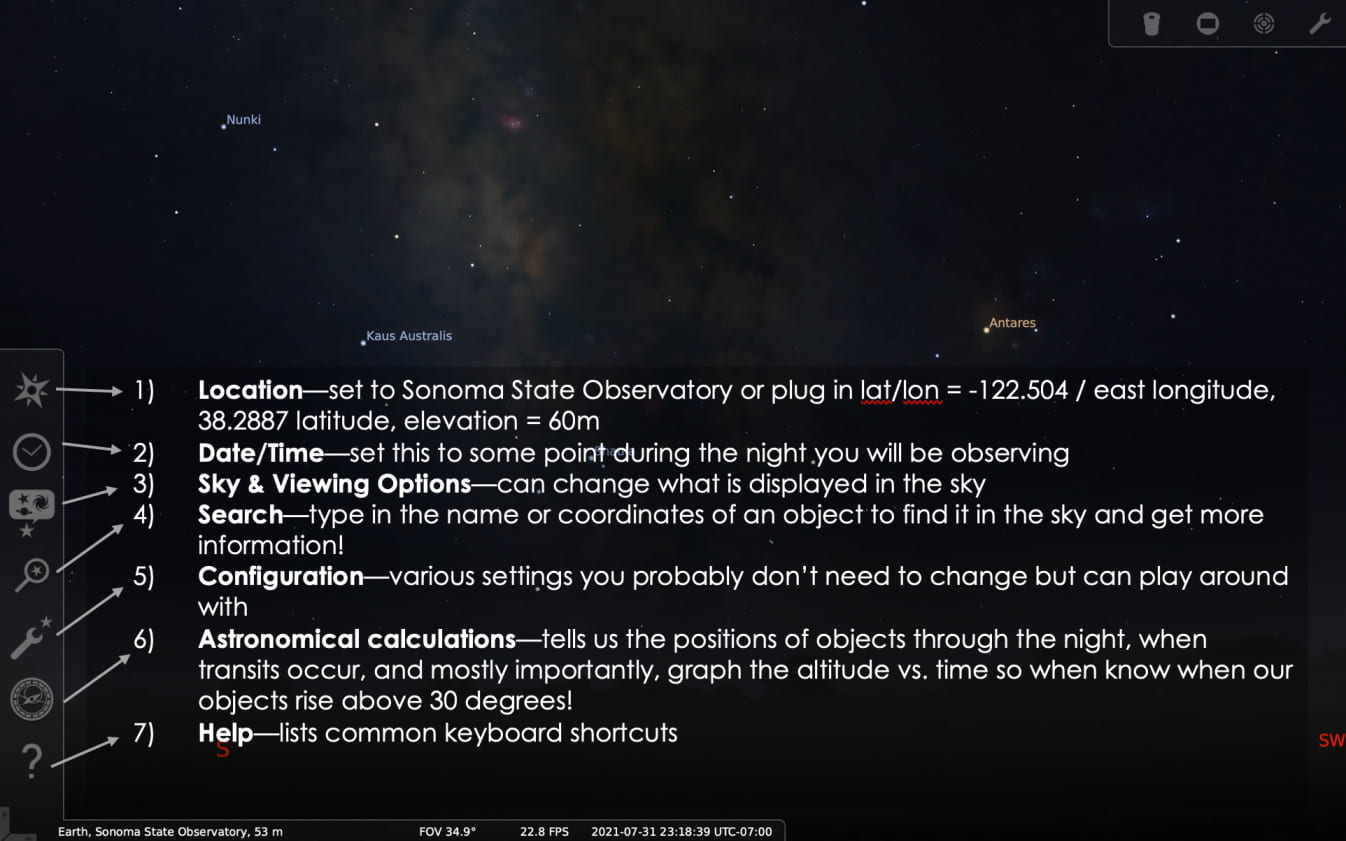
Stellarium is a FREE, open-source planetarium software. You can download it for Windows, Mac, or Linux, run it on the web, or use it as a mobile app. This app lets you view the night sky at any point in time and at any location on Earth (and beyond!). You can go back 2000 years and see what the sky looked like in ancient Greece, go into the future to see the sky from Jupiter’s moons, or just see what cool objects are up during your SEO observing session tomorrow. You can see the deep-space objects that will be visible, get an understanding of how the sky changes over time, or even see the constellations of other cultures!
Stellarium has many, MANY different features and I won’t go over all of them in this article, but there are plenty of tutorials and videos about all of its cool features online. Here’s a good one on getting started.
The simplest path to checking when you can observe a certain object is as follows:
- Enter the location of SEO in the Location window (first tab on the left menu as shown above) either as Sonoma State Observatory (this is not actually SEO, but it’s the closest named location and shouldn’t be too different) or plug in SEO’s coordinates.
- Set the Date and Time (second tab) to sometime during the night of the day you’ll be observing.
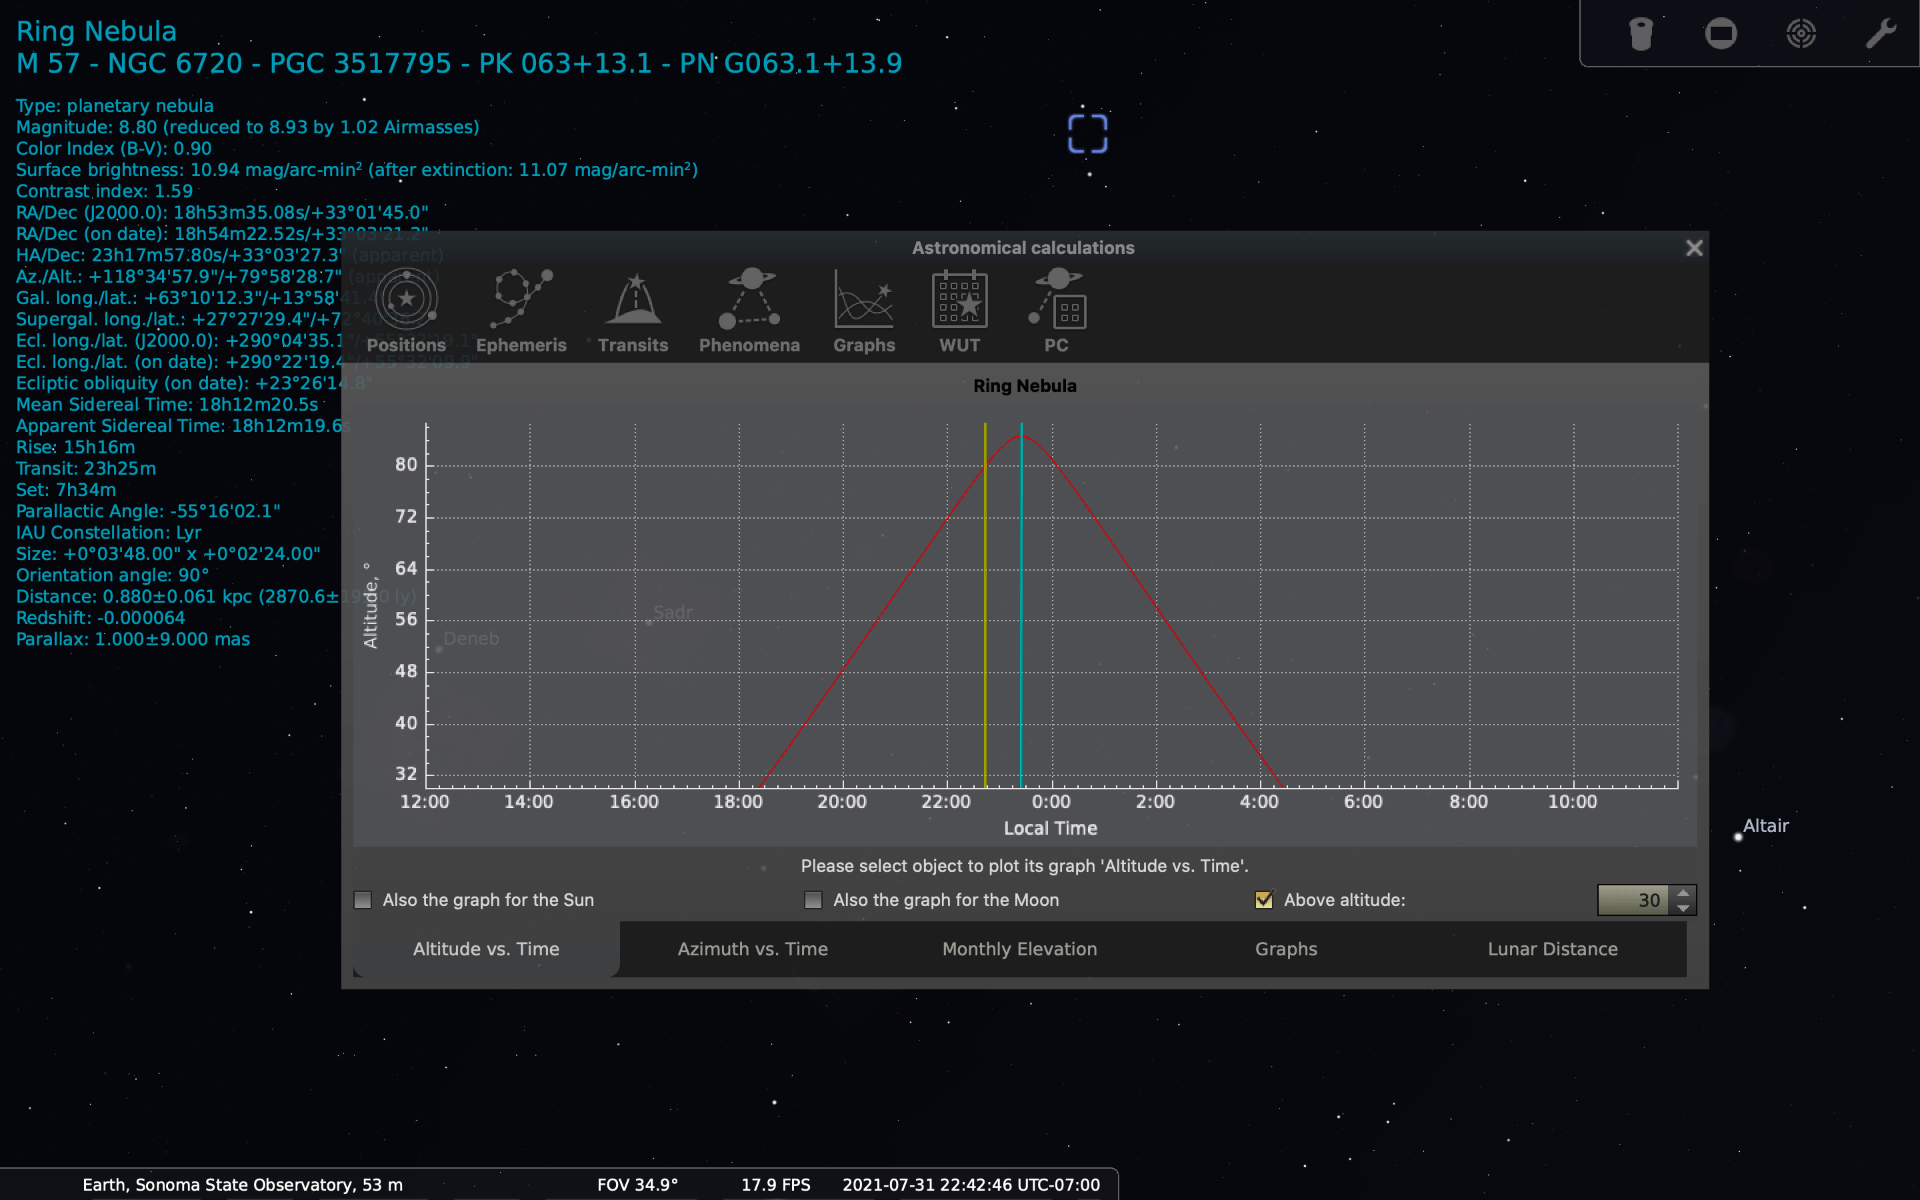
- In the Search menu (fourth tab), type in the name of your object and hit Enter. This will bring up a view of the object. You’ll immediately be able to tell where it is in the sky. On the left, a lot of cyan text will pop up that has more information about your object. The numbers to pay attention to are Magnitude, Surface Brightness, and Az./Alt. Magnitude and Surface Brightness, as mentioned before, can help you evaluate if the object is bright enough to observe. The Az./Alt. tells you the Azimuth and Altitude, respectively, of the object at the time you set. This is where you can make sure the object is above 30 degrees in altitude. If it’s not, try moving forward or backward in time to see if your target ever gets that high. If it doesn’t, you should find another target to observe.
- An easier way to evaluate if your object gets high enough and to see when it will be the highest is by going the Astronomical Calculations window (sixth tab) and going to the Graphs tab. This will display a plot of the altitude of your object over time as a red line, the current time as a vertical yellow line, and the time at which your object crosses the meridian (i.e. is at its highest point in the sky) as a vertical cyan line. You can also check the boxes underneath the plot to see the altitude of the Sun and Moon and also change the vertical axis of the graph to begin at a certain altitude, which you’d want to set to 30 degrees. An example of what this screen looks like is below. Use this to see what time is optimal for observing a particular target.
The Search feature in Stellarium also has a tab called “Lists” that has a wide variety of compiled lists of various objects: bright clusters, nebulae, planets, the Messier catalog, etc., etc. Use this this to get insipration for objects to observe or find a specific object of a particular type.
Telescopius
Telescopius is a great website for finding objects to observe! It also has a planetarium-type interface like Stellarium and you can set your observatory location and even camera details and it will make a curated list of good observing targets, showing their altitude vs. time graphs. You can even narrow down objects by searching for a particular type (nebulae, open cluster, etc.) or by magnitude, surface brightness, etc. The interface also allows users to create Observing Lists and plan mosaic imaging of objects larger than the field of view of the camera! The bottom line is that Telescopius has A LOT of customizable search options you should definitely play around with, and we won’t be going over all the details here. That said, here are some resources to get your started:
- Planning on observing session with Telescopius
- YouTube video about using Telescopius with astrophotography
- Another YouTube video showing a bit of Telescopius’ features
Check: Have you requested time?
Now that you have some targets you’re excited about observing, make sure that you’re either observing as part of a group (i.e. SEASS) or have let someone know you’d like to observe by requesting time on the telescope. If you haven’t done this yet, read this part of our FAQs to learn how to request time!
Important note: Since you really only want to observe after the sun hits -18 degrees in altitude, make sure you plan your observing time accordingly. It might take another 1-1.5 hours for the sun to go from sunset to -18 degrees, so don’t just schedule time assuming you can start at sunset!
What tools do I need to observe with SEO?
Alright, you’ve been okayed to observe and the weather conditions are looking good!
The beauty of SEO is that all you really need to observe is a device with an internet connection that has Slack on it. That’s it. You can lie in bed and observe using your phone, computer, or tablet from thousands of miles away. Isn’t that cool?!
Click here to get information on how to download Slack and what workspaces you should join before you begin observing.
You might also want to have Stellarium and/or Telescopius open in case you want to make any last-minute additions or changes to your observing list. If you want to look at the images you’ve taken, SAOImageDS9 is also a fantastic software to have that lets you view the particular type of image files SEO gives back (more on this further down in this post).
#ixchel: May the Mayan goddess of the moon be with you
You might wondering, “Slack is used for messaging people…how in the world does this let me move a telescope around the world and take images with it?”. That’s where #ixchel comes in!
#ixchel is a channel on the Stone Edge Observatory Slack you should have joined. It’s set up as as a command line type interface to communicate with the telescope and its camera. All this means is that everything you could possibly want do do with SEO is done by sending a simple command in the #ixchel channel.
All commands begin with a backslash \. #ixchel doesn’t understand anything that’s not a command, so you’re free to also type regular chat message here if you’re observing with a group, without worrying that you’ll accidentally tell SEO to do something.
The first command you probably want to send it \help. This pops up a list of all the available commands you can give #ixchel and a short description of what they do. There are a lot of possible commands, but you usually won’t need to use all of them. You can read through to see what each of them do and start getting a feel for which commands might be important.
Two important notes about #ixchel:
- Please do not send multiple commands at once or repeat the same command multiple times before the previous command has finished executing. This can cause the telescope to malfunction.
- That said, SEO is very difficult to break. There are a lot of fail-safes installed into the system so the user, whether accidentally or maliciously, can’t send a command that will harm the systems permanently. I’m not telling you this so that you can try to break the system (please don’t!) but to assure you that as a beginning user, you might make mistakes. And that is okay! We’ve all messed up one way or another using SEO, but don’t be afraid to use the scope or lead an observing session because you’re afraid something might go wrong!
- The first few times, you’ll be observing with someone experienced, so they will be there to help troubleshoot.
- Things can go wrong at any point no matter who is using the telescope. Most of the time, errors that pop up are not the fault of the user, but something in the software or hardware that needs fixing. If something unexpected is going on, don’t panic. Below, we’ll go through some common errors you might get and how you can try to fix them. If something happens you’re not sure how to deal with, you can always message Amanda Pagul or Matt Nowinski (he’s the guy that wrote #ixchel!) on Slack or message the #general channel and someone will come to your aid!
Now that you’ve met #ixchel and are hopefully excited about your observing session, let’s begin!
It’s time to crack open the dome!
Locking the Scope
When it’s your time to observe, the first command you want to give #ixchel is \lock. This will prevent #ixchel from acting upon commands from other Slack users so that they can’t interfere with your observation. There are some commands (like \help) that can be called without locking your user in, such as ones that only give information and don’t change any of the settings on the telescope or camera. \lock should pop up a welcome message with your Slack username and also have a handy hyperlink to the observing FAQ.
If you’re observing with other people, you might want every person in your group to be able to control the telescope. In this case, after you \lock the telescope, you can send the command \share on, which will share your lock so that other Slack users can also send commands. Though it may seem that this has brought you back to the initial state of “anyone can send commands”, you must first \lock the telescope before you can send the \share on command so that #ixchel knows you, the primary user, has granted other people access to the controls. If you’re ever unsure of who’s locked the scope, you can always run the \who command which will tell you just that. If you want to switch back to being the only user who can send commands, just enter \share off and your lock will be un-shared.
Checking the Weather and Sun
Once the scope has been locked, it’s time to do some preliminary checks to make sure the weather conditions are still good for observing. \clearsky will make that Clear Dark Sky chart we talked about earlier pop up (you can ignore all the charts after Sonoma, CA). If you want more recently updated data, \weather shows you the current weather in Sonoma, and \forecast will show you the predicted weather conditions over the next few hours. You can also call \clouds to just see the current cloud cover percentage, but this sometimes gives back nonsensical answers (i.e. -2%, 124%), so it’s better to cross-check with other weather sources. Last but not least, \skycam is a fun command that lets you see a video feed of the sky from SEO. Make sure these conditions look good before continuing.
Now it’s time to check whether the sun is low enough to open the dome. Even once the sun goes below the horizon (0 degrees in altitude), it’s still pretty light outside, so we want to wait until astronomical twilight. There are actually two other types of twilight (civil and nautical) but we only care about astronomical twilight, which is defined by the time the sun reaches -18 degrees in altitude. By then, the sky should be sufficiently dark to get good quality images. Run the command \sun to see the sun’s precise altitude. If it’s -18 degrees or below, you are good to go!
Opening the Dome
To open the dome, run the \crack command. This might take a little bit, and #ixchel should tell you “Cracking observatory. Please wait…” and then “Telescope is cracked.” once the dome has been opened. The telescope will not open if it deems the weather too bad (too cloudy for example) or if the sun is too high.
Finding an Object
Time to find your first object! Use the \find <object> command to do this, where <object> is the name of your target. For example, \find M42 will tell #ixchel to look in its database for the object Messier 42, also known as the Orion Nebula. You could also have put in \find orion nebula and #ixchel should also understand that. #ixchel should look for your target and send you back all the matches it found. Sometimes, it can find more than one if, for example, your target name is also part of the name of another object like a satellite. You can usually tell which match is the one you need because you can see the Type of the object: either Celestial, Solar System, or Satellite. If you’re looking for any deep-sky object like a nebula, galaxy, or cluster, the object should have Type Celestial. If you’re looking for a planet, it should have Type Solar System. This will also give you the current RA/Dec, Altitude, Azimuth, and Magnitude of the object. Looking at the altitude and seeing if it’s greater than 30 degrees is also a good way of verifying that #ixchel has found the correct object.
Plotting your Target
Now you can make a plot of your target’s altitude vs. time like in Stellarium. Use the \plot <object #> or \plot <RA (hh:mm:ss.s)> <DEC (dd:mm:ss.s)> command to do this. When you ran the \find <object> command, it should have given you a numbered list of objects. You can either put this number into the \plot command or input the RA and Dec of the object you want in the format listed. You only need to do the latter if the object you want to image is not named or not in #ixchel‘s database. If #ixchel only returned one match or the match you want is the first one listed, you can also just run \plot without specifying the number because \plot defaults to graphing the first result given by \find.
The resulting plot will look something like the image below:
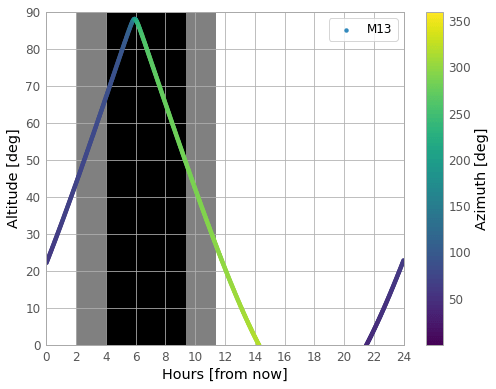
The altitude of your object is plotted as line which is colored by its azimuth. The horizontal axis shows the time from now, where the origin corresponds to the time when you made the \plot command and the right-most limit a full day from then. The black background means it’s dark enough to image, and gray is twilight. You want to observe your object when during the time when it’s dark, so look for the black region. This is the block of time when your target is theoretically observable. In the example above, M13 would be in the correct region between 4 to 8.5 hours from the time the plot was generated. That said, don’t forget about the altitude limit!! Your target must also be above 30 degrees in altitude. You can use these plots as a check for when the optimal time to observe is: though you might want to image the object at its peak altitude, this might not be possible due to SEO’s observing constraints, so you can choose to observe it when it’s highest during the allowed observing window.
Pointing the Scope
If your target is in the allowed observing window now, you can safely move the telescope there! There are two commands for this: \point <object #> or \point <RA (hh:mm:ss.s)> <DEC (dd:mm:ss.s)> and \pinpoint <object #> or \pinpoint <RA (hh:mm:ss.s)> <DEC (dd:mm:ss.s)>. These work the same way that the \find <object> and \plot <object#> or \plot <RA (hh:mm:ss.s)> <DEC (dd:mm:ss.s)> commands do. \point will find the object’s RA and Dec in a database, send the telescope there, and tell you the command is complete. \pinpoint is a more precise version of this. It will also find the target’s coordinates and go the specified location, but once it’s there it will take a 10 second image exposure and use code from a web service called astrometry.net. This code will then tell #ixchel the exact coordinates of the center of the object which #ixchel will then use to nudge the telescope a bit and precisely center your target in the camera frame. For bright targets such as the moon or planets, you want to use \point. This is because these objects are very bright and you don’t want the camera taking a 10 second exposure as this can mess with subsequent images. For any other targets, such as any deep-sky objects, you can safely use \pinpoint.
❗❗❗ Sometimes \pinpoint doesn’t work and will cause #ixchel to tell you Error. Command (\pinpoint) failed. This can happen for a variety of reasons and sometimes it can be hard to figure out what the problem is. First, try taking a short 10 second exposure in the clear filter (read on to learn how to do this) to see if your object is actually in frame or not. If it’s not, try using the \point command instead. If it’s still not working, try pointing to another object you know is visible now. If the pointing is failing no matter what object you try, your best bet is to run the command \home dome. This will let the dome “reset” and calibrate itself. Note that this will shut down the scope, so you’ll have to run your find and (pin)point commands again once this is complete. If you’ve tried all of the above, it’s time to message either Matt Nowinski or Amanda Pagul on Slack and let them know what’s going on.
Taking your First Images
If your pointing was successful, you can now begin the real fun: taking beautiful images! This is done through the \image <exposure (s)> <binning> <oiii|g-band|r-band|i-band|sii|clear|h-alpha> <count> command. Let’s talk about these parameters:
<exposure (s)>: The exposure time of your image in seconds, or in other words, “How long should the camera shutter stay open?” A good initial guess for exposure time would be 60 seconds for a brighter deep-sky object and 120 seconds for a fainter one. This is just a simple rule of thumb and will change depending on the object, sky conditions, etc. so after a few observing runs you’ll start getting a better intuition for this.<binning>: Basically your image resolution. This is a number between 1 and 3 and tells the camera how many pixels to merge into a larger pixel. bin 2 is a good starting point, though you can play around between bins 1 and 2 and see what looks better.<oiii|g-band|r-band|i-band|sii|clear|h-alpha>: What filter you want to take your image in. As the name might suggest, these filters only let in certain wavelengths of light and using a combination of filters you can create a color image of your object. See the SEO FAQ page if you want more information about the specific filter wavelengths SEO uses. For now, you can remember the rough correlation of g-band=green, r-band=red, and i-band=infrared. These are what we call broadband filters, ones that let in a broader range of wavelengths. The other three are emission-line filters: oiii=Oxygen III or doubly-ionized Oxygen, sii=Silicon II or singly-ionized Silicon, and h-alpha=Hydrogen Alpha, an atomic transition in a Hydrogen atom between the third and second energy levels. oiii is good for observing gaseous planets and nebulae, sii is good for increasing the contrast between objects, and h-alpha is good for observing regions of star-formation like emission nebulae. These three are called narrowband filters because they only let in a very narrow range of wavelengths centered around wavelength of the specific emission line. A good rule of thumb is that your exposure time for narrowband filters should be longer than that of your broadband (for example, 120 seconds vs 60 seconds). Finally, the clear filter just lets in all wavelengths (so like taking an image with a regular camera).<count>: The number of images you want to take of this object in your specified binning and filter. The default is 1, but you can do up to 10 exposures with this one command. If you need more than 10, you’ll have to run this command again. This ensures that users can’t input an insane number of exposures and clog up the imaging queue and prevent other users from accessing the scope.
Note that all commands with multiple parameters must have the parameters separated by a single space, or else #ixchel will throw an error. For example, you must do \image 60 2 g-band and not \image 60 2 g-band 1 or \image, 60, 2, g-band.
When the scope arrives at the location of your object, it’s always good to take a diagnostic image by inputting something like \image 10 2 clear 1 to make sure the scope has pointed properly and there are no problems with the camera.
Now that you know how to find objects, plot them, point the telescope, and take images, you’re clear to complete your observing run! Remember you can always call the \help command whenever you need a reminder about how a command works. You can keep going as long as you stay within the time period you’ve booked with Amanda or until clouds unexpectedly come rolling in. If you finish observing all the objects you want early, feel free to keep taking more images of any other targets you might be interested in!
So…sleepy…time to go to bed💤
When it’s time to start winding down for the night, you can shut down the dome by running the \squeeze. #ixchel should verify this by telling you Squeezing observatory. Please wait..., followed by
Telescope is squeezed. when finished. This might take up to a minute or so.
❗❗❗ Squeezing the dome when you’re done is VERY important!!! It’s very easy to forget to do this after you’ve been up all night and are extremely tired, but set a reminder for yourself and double check that you have closed the dome. As a fail-safe, the dome will close automatically in the case of inclement weather or when the sun starts to rise, but we don’t want the telescope exposed to the outside elements longer than it needs to be.
After this, you can run the command \tostars. This will send all the images you have taken to an online server where you can then download them. This is actually automatically done every 15 minutes and you can run this command at any point during observing session if you want to play around with your raw images earlier.
Last but not least, \unlock the scope so that other users either later in the night or the next day can use the scope.
And that’s it! Congratulations!! You have just completed an observing session using Stone Edge!!
Recap
Here is a short recap of the general basic commands you’re going to be running during an observing session, in order:
-
\lockto lock yourself in as the primary user and command-sender,\share onif you’re observing with a group.\weather,\forecast,\clearsky, and\cloudsto check the observing and weather conditions for the night.\sunto check if the sun is below -18 degrees altitude.\crackto open the observatory.\find <object>to let #ixchel find your desired object in its databases.\plot <object #> or \plot <RA (hh:mm:ss.s)> <DEC (dd:mm:ss.s)>
to see the altitude of your object over a 24 hour time period and see when it’s observable by SEO.
\point <object #> or \point <RA (hh:mm:ss.s)> <DEC (dd:mm:ss.s)>for pointing the scope to brighter targets like planets and the moon or\pinpoint <object #> or \pinpoint <RA (hh:mm:ss.s)> <DEC (dd:mm:ss.s)>for pointing at deep-sky objects.\image <exposure (s)> <binning> <oiii|g-band|r-band|i-band|sii|clear|h-alpha> <count>to take up to ten images of your target with your desired exposure time, binning and filter.\squeezeto close the dome.\tostarsto send your images to an online server for your retrieval.\unlockto release your lock and let other users control the telescope.
I’ve taken a lot of images! How do I download them?
To get all the images you took during the night, you need to access the Stars Server at https://stars.uchicago.edu/images/StoneEdge/0.5meter/. Once here, click on the year you observed (2023 right now) and the date of your observing session (the date listed will usually be the date you started the observation in UTC, which has usually crossed over to a new day by the time it get dark in Sonoma, so if you observed on the night of 06/01/2023, your images would be under the 2023-06-02 folder). Once there, click on your name/username and all your images should be right there!
Each file should be labeled with the object name, filter, exposure time, and binning. Each file should also end in _<something>.fits.gz. If you’re looking at the Stars Server during or right after you finished observing, you will only see files ending in _RAW.fits.gz. Like the name suggests, these are the raw FITS file straight from the camera and have not been processed in any way. They will be noisy and have hot pixels, dust, etc. still on them. You can download any image by clicking on it and then unzipping the file. As of June, 2023, there is no way to download multiple images at once through the cite–sorry about that! You can use ftp, wget, rsync if you’re command line savvy.
Over the next couple days, all of the images taken by SEO that night will be run through a reduction pipeline to remove all the noise and unwanted features. Every time the pipeline runs a step, it will output the intermediate image into the Stars Server, so for each exposure you will see five files that correspond to the five intermediate reduction steps. You don’t really have to worry about what the intermediate steps do, the important thing to know is that the fully reduced image has the ending _WCS.fits.gz. This image has been reduced with calibration frames and also has a World Coordinate System (WCS) in its header that is useful for stitching images into a mosaic or stacking images on top of each other. To learn about image reduction and how you can manipulate them to create these, check out our Guide to Image Reduction (available soon!)
Now that I have images, can I look at them?
All the files that SEO outputs are in the FITS (Flexible Image Transport System) format. These is the standard file format for astronomical images. The easiest way to view FITS images is using a software called SAOImageDS9, which is available for Mac, Windows PC, or Linux machines.
Once you open DS9 it should pop up a window with menus and blank white screen. You can then open an image you’ve taken by going to the File menu, clicking Open, and choosing the file you’d like to display. Now you can play around with the Scale and Zoom menus to view your image just the way you like it (uh huh, uh huh). See this, this, this, and this video for some tutorials about using DS9 and making color images for a crash course. For a more thorough guide to astronomical images and image reduction, check out our Guide to Image Reduction (available soon!)
