Pitch: Blockchain in the Supply Chain

Problem: Broken Supply Chains

A small product such as an iPhone can have thousands of different components creating a complex supply chain. Making the product is also a complex process involving setting up contracts and coordinating with numerous suppliers and distributors. During the production process, a product may travel through many different nodes. As an example, the base components of an iPhone could be made at one factory and the finishing components at another factory. When there are defects in the product, it may be difficult to pinpoint when the defect occurred or who is responsible for it because there is no secure ledger that reliably tracks every action performed during the production/supply-chain process.

In short, the often-limited transparency of where a product or component is in the supply chain can make it difficult to address issues related to loss, misdelivery, or decision-making.

Solution: Blockchain in the Supply Chain

To solve these issues, our start-up will integrate blockchain technology into the tracking process of the product’s construction. As a product moves from one location to another, an entry will be made into the ledger system, which tracks when the product left the facility, what state it was in, and who handled the delivery. Once the product is received by the next party, that party will modify the block with information regarding the receipt time, state of the product, as well as any modifications that it makes. During this process a contract can be updated for the parent company to monitor that their suppliers are maintaining the agreed-upon standard of materials being used in the product.

For example, when Apple receives glass covers for their phones from a supplier, the supplier will fill in details regarding the state of the glass and the details of the transaction. Apple can then verify that the agreed-upon units are received as well as the condition they are received in. When auditing the supply chain in case of any disputes, it will be easy to see where mistakes happened and who is culpable.

Furthermore, blockchain technology would apply to both the financial transaction as well as physical transactions of products. In order to facilitate the tracking of the physical transactions, RFID or a similar technology would need to be applied to every shipment.

Ultimately, this innovation could also aid in 1) better tracking against counterfeit products, 2) ensuring compliance with regulations for all components, 3) minimizing transition costs at each stage of production and manufacture, and 4) identifying and mitigating myriad inefficiencies along the supply chain.

Pilot: Apple

In order to demonstrate the application and value of blockchain technology in complex supply chains, we propose using Apple’s iPhone as a pilot.  Every component of Apple’s iPhone would be tagged, either at the individual product level or at the bulk shipment level. As components are assembled and change hands from manufacturer to manufacturer, the transactions would be tracked using blockchain technology on a permissioned ledger. As each transaction happens, both Apple and the manufacturer can enable the supporting financial transactions and smart contracting to occur as well.

Photo credit: Accenture Strategy

Value for both Suppliers and Manufacturers

End-to-end visibility and immutable smart contracts can enable value for both Apple as well as its suppliers, especially in the case of disputes. For a company like GTAT, which supplied sapphire for the screen of iPhones, a contract that is secured by blockchain might have helped save them from bankruptcy. In the original contract that GTAT had with Apple, the company was not allowed to make any modifications to the iPhones. There were also components of the contract that they did not have firm agreements on. Apple was not obligated to buy any of the sapphire GTAT made and as such, when Apple pivoted to a different supplier, GTAT had no way to make Apple buy their product. GTAT was obligated to accept and fulfill any orders by Apple for sapphire glass, but didn’t have any clause stating that Apple always needed to buy the product. GTAT ended up having to pay $439M to Apple for the right to stop supplying sapphire when Apple terminated the partnership, leaving GTAT an obligation to payback the $439M advance used to fund GTAT’s new production facility. [6]

Future

After a pilot with Apple’s iPhone, we plan on expanding to other Apple products.  Once the application has proven itself with the full suite of Apple products, we would then either expand to other companies with similar businesses, such as Samsung or GE or sell this product to Apple. Ideally, we would expand to other businesses and eventually other industries with complex supply chains, including food and beverage, retail, and oil and gas.

Risks and Competition

Primary risks of this innovation are 1) that the technology is still in its infancy, 2) the complexity of the technology and its applications, 3) the decentralized nature of supply chain and logistics for electronics components and the differences in regulations and compliance in different markets where components are produced, and 4) stakeholder adoption across the supply chain will likely prove challenging.

In terms of competition, there are other start-ups emerging in this space, such as companies like the MIT-founded Eximchain [7], and Cloud Logistics. Foxconn, the manufacturer of the iPhone, has developed an early-stage blockchain prototype [8], and Samsung Electronics has a blockchain platform underway. Additionally, Amazon has undertaken projects internally that could pose competition to our product.

Sources:

[1] Deloitte: Using blockchain to drive supply chain transparency https://www2.deloitte.com/us/en/pages/operations/articles/blockchain-supply-chain-innovation.html

[2] NY Times. Blockchain: A Better Way to Track Pork Chops, Bonds, Bad Peanut Butter? https://www.nytimes.com/2017/03/04/business/dealbook/blockchain-ibm-bitcoin.html

[3] How Blockchain Will Transform The Supply Chain And Logistics Industry

https://www.forbes.com/sites/bernardmarr/2018/03/23/how-blockchain-will-transform-the-supply-chain-and-logistics-industry/2/#7c5625f6416c

[4] Blockchain for the Electronics Manufacturing Services Supply Chain

https://www.ibm.com/blogs/insights-on-business/electronics/blockchain-ems-electronics-manufacturing-services-supply-chain/

[5] Why Blockchain is a Game Changer for Supply Chain Management Transparency

http://www.supplychain247.com/article/why_blockchain_is_a_game_changer_for_the_supply_chain

[6] http://fortune.com/2014/10/29/apple-and-gtat-what-went-wrong/

[7] https://www.coindesk.com/mit-founded-startup-raises-20-million-for-supply-chain-blockchain/

[8] https://medium.com/@hermione1/foxconn-to-blaze-the-trail-blockchain-for-electronics-6742abc8aea1

[9] https://btcmanager.com/samsung-electronics-to-employ-blockchain-technology-to-augment-supply-chain-network/

Team members:

Pavlina Plasilova, Kelly de Klerk, Yuxiao Zhang, Aziz Munir, Megan McDonald

Pitch: A Platform the Augment the Market for Electric Vehicle Charging and Solve the Duck Curve Problem

Opportunity: the growing EV market exacerbates existing challenges for electric utilities.


Electric Vehicles (EVs) are a rapidly growing market that’s expected to grow to significant size in the next decade. Below charts are from the International Energy Agency’s Global EV Outlook 2017 report and Edison Electric Institute’s prediction that the US will have 7M EVs by 2025.


Energy Utilities are taking notice. Utilities actively encourage EV adoption as they view it as an important future revenue stream. Southern California Edison’s report on EV adoption notes that utilities care about the location, charging schedule, and habits of EV owners. And, for good reason — EV households have significantly different energy use profiles:

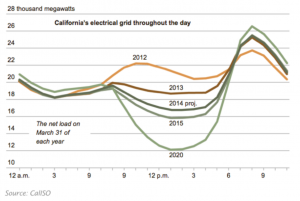
Finally, the rise of renewable energy production in the grid has created new challenges for utilities. Utilities have long faced a deepening “duck curve,” which is greatly exacerbated by the above EV charging profile.

The electric utility market is a government-sanctioned geographic monopoly, and EV charging is fast becoming an important part of that market. We propose a solution to augment that market through tracking EV user habits and incentivizing behavior to flatten the duck curve.

Solution: Platform to augment the EV charging-Utility market and flatten the duck curve

We take inspiration from the NREL researcher that predicted and studied the duck curve: Paul Denholm. In an interview with Vox, he states that if utilities could provide the right price incentives, EV charging could be used to flatten, rather than exacerbate, the duck curve.

We propose creating a platform that connects the electric vehicle’s system to the cloud and use the data collected to collaborate with the utility companies in order to optimize the value for all parties involved. The platform would analyze the driver’s habits and calendar, predict future behavior, then advise the driver when to charge based on both optimized pricing and predicted future driving requirements. It would provide utilities with a representative data set with which they could predict demand and optimally price to encourage flattening the duck curve.

Because this platform would require both widespread deployment of software on EVs (which isn’t yet easily done) and cooperating with an electric utility, we think an EV OEM is best positioned to develop a joint venture with a utility and implement our platform. Therefore, we are proposing this solution for Tesla to incorporate into the software for its electric vehicles. This would be mutually beneficial for drivers, utility companies, and Tesla:

  • Drivers: the application would help drivers remove the decision-making process of when and where they should charge their electric vehicle. Using a surge-pricing model, drivers would be incentive to charge their vehicles at locations that best fit their specific priorities (i.e. cost, time, range anxiety). For example, drivers would be able to plug their car in overnight and the system would then optimize at which times that night the car would be charge (i.e. 1am-3am and 5-6:30am).
  • Utility companies: By leveraging the data generated by the system, the utility companies would be able to predict electricity usage and optimize energy production and maintenance of its assets in different areas. It would also help them set pricing to encourage smoothing of demand surge throughout the day. Lastly, eventually, utility companies will be able to optimize where to expand when and where to invest in the CapEx of expanding charging stations throughout a particular current city or expand to a new one.
  • Tesla: the main benefit for Tesla is the differentiating advantage that it gives them over competitors. For example, Tesla could use the data to negotiate a cheaper electricity rate with utility company, attracting consumers to choose their EV rather than competitors.

Feasibility is increased if an OEM implements this solution.

As the density of EVs which have the solution installed increases within a specific area, the platform will gain more profound insight into the usage patterns of geographically clustered consumers. By understanding their preferred routes, planned trips and holidays, and charging habits, the platform will suggest the most appropriate time for the consumer to charge their EV based on their preferences (i.e. convenience vs pricing).

That considered, the feasibility of the solution rests primarily on the ability for the platform to be scaled. For success, there must be a representative sample in any and all given geographical locations that the solution is marketed for the necessary insights to be achieved.

Given that a lack of scale is the most challenging obstacle preventing a dataset significant enough to draw insights, the implementation will be best suited to rollout from an EV manufacturer. The OEM’s willingness to adopt the software and install as standard in all vehicles will provide the scale required, increasing the utilisation percentage as the EV market booms in the coming decade.

Pilot: Tesla uses OTA to implement a test-run in a small market

Tesla is currently the EV manufacturer best positioned to implement this solution. To begin the pilot, Tesla would implement the algorithm by releasing it as part of an over-the-air (OTA) update to a portion of its existing customer fleet. Data is collected both on the usage of each vehicle and the recharging preferences manually entered by end users. This approach will build on its existing data set of travel routes, providing a deeper understanding of consumer preferences for recharging based on their disclosed preferences and inputs on future travel plans by end users.

Once the customer-specific usage patterns of all Teslas within each specific geography is understood, Tesla can predict future usage patterns for where and when all Teslas are expected to travel and recharge, based on machine learning and AI modelling. This data will identify periods of high demand, which will be of particular interest to utility companies.

Tesla can then share these predictions with utility players, encouraging them to charge variable pricing within specific time periods of geographies. Variable pricing will allow utility providers to smooth out their demand curve and increase margins. In return, Tesla may wish to negotiate lower kWh rates at public charging locations

Competitors & Risks

There are many applications that help EV drivers find charging stations, but none have the ability to predict pricing or analyze a driver’s behavior to recommend charging time.

GM is the main Tesla competitor for plug-in EVs in the US; GM could implement a similar solution. However, this would probably help — it would get more utilities on-board with dynamic EV charging pricing to influence demand curves.

One critical risk is driver adoption of the service. Drivers face significant range anxiety, which is a key barrier to EV adoption (despite the irrationality of this fear). The temptation to plug in the EV and charge it as soon as the driver gets home from work is pretty strong. The application and utility can defeat this in three ways:

  • Set prices to significantly incentivize changing charging behavior
  • Track savings accrued — recognize good behavior
  • Reliably predict the driver’s schedule to avoid an under-charged emergency

Sources

Global EV Outlook 2017 report: https://www.iea.org/publications/freepublications/publication/GlobalEVOutlook2017.pdf

SC Edison report on EVs: https://newsroom.edison.com/internal_redirect/cms.ipressroom.com.s3.amazonaws.com/166/files/20136/SCE-EVWhitePaper2013.pdf

SEPA report on energy grid preparedness for EVs: https://www.utilitydive.com/news/time-is-not-on-their-side-utilities-ill-prepared-for-ev-demand-sepa-finds/519530/

Vox Article with Denholm, discover of the duck curve: https://www.vox.com/energy-and-environment/2018/3/20/17128478/solar-duck-curve-nrel-researcher

Forkable

Opportunity

The US lunch industry is in a state of flux with an ever-increasing number of businesses opting for in-office options vice eating in a restaurant to either increase productivity or provide additional work benefits. Traditionally, many companies have spent large amounts of money on office catering, which largely goes to waste.  Thus many firms are turning to technology to answer the question, “what should we have for lunch?” As such, firms now specialize in delivering individualized, restaurant-quality food directly to the workplace. These firms take advantage of the many restaurants offering a wide variety of food near urban offices. However, ordering lunch for a large group of coworkers can be a time consuming task, particularly when attempting to ensure everyone gets what they want.  Forkable seeks to bridge all of these elements and use machine learning and technology to match workers to restaurants (food) and vice versa.

Summary of Solution

Forkable uses customer inputted preferences, meal feedback ratings, and individually indicated tastes along with machine learning algorithms to learn the food preferences of office workers and then automate the food ordering and delivery process for individually satisfying office lunches.  This approach reduces the complexity of ordering lunch for large office co-worker groups by not only predicting what restaurant and food every person in the group will enjoy, but also completing the ordering, pickup, and delivery of those lunches. Forkable also allows for users to meet budget constraints and use human override if required. Additionally, Forkable eliminates the waste associated with catering corporate lunch as well as cutting down on the internal administrative cost of ordering lunch, saving companies money.

Effectiveness and Commercial Premise

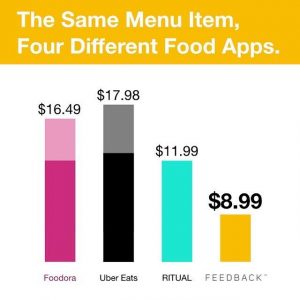
Forkable is part of the emerging space that is the intersection of the $9B catering and $200B U.S. lunch markets. In this area, firms typically charge a delivery fee plus an order surcharge to generate revenue. As Forkable is still very much in the startup phase, it remains impossible to directly measure either the potential or effectiveness of Forkable. However, Fooda may provide a closer benchmark by delivering meals from a single restaurant, earning $48M in revenue in 2016. At the top end, Grubhub provides a measure of a large, public company that allows one to achieve the same results with more effort required from the user, generating $683M in revenue in 2017.

Competitive Landscape

Lunch catering is a crowded and diverse competitive landscape.  There are low barriers to entry and a wide variety of approaches to catering.  There are traditional businesses that have a limited tech presence, but will cook, deliver, and serve the food.  There are also a variety of well known tech-enabled businesses, like Grubhub, Postmates, and Uber, which focus just on the delivery of the food from restaurants to customers.  Other lesser known office-catering businesses include Fooda and Eat Club. Fooda’s business model involves bringing local restaurants into offices to serve a selection of food directly to the customers.  This model is interesting and can operate with low overhead, but a narrow selection from a given restaurant will not necessarily have something that everyone likes. Eat Club has a model that is similar to Forkable in that it allows customers to individually select their preferences.  In this way, it is similar to just ordering from a menu. It does not use machine learning to select dishes and restaurants which are best suited to customer preferences in the way that Forkable does.

Proposed Alterations to Increase Value

Forkable currently optimizes meal selection for the customer through the previously described preference-rating feedback loop. However, restaurant selection occurs by using websites known for ratings, such as Zagat, Yelp, and Foursquare, and selecting 10 restaurants in a given area from which to offer meals. As a result, the process could be improved by using machine learning to optimize restaurant selection. Forkable would take the upcoming week’s customers (which they know in advance) and identify the restaurants through machine learning within a predefined radius that provides the highest number of potential matches for the customer set. This process would accomplish two goals. First, it would increase the quality of the service and customer satisfaction as a result. Second, it would decrease costs through both restaurant search-radius optimization (i.e., pick an adaptable area that will minimize delivery costs) and decreasing the cost of customer acquisition/retention. By offering a higher quality service at lower cost, Forkable would increase its customer base, attract more restaurants, and be able to offer more options, all part of the virtuous flywheel associated with indirect network effects. As a result, this improvement would both create value as the emerging market size increases, as well as capture value by removing other close competitors such as Fooda and ZeroCater.


Sources

Forkable

https://forkable.com

Forkable Wants Companies to Forgo Buffet Style Lunches

https://thespoon.tech/forkable-wants-companies-to-forgo-buffet-style-lunches/

Grubhub 10-K

https://www.sec.gov/Archives/edgar/data/1594109/000156459018003852/grub-10k_20171231.htm

Food Tech Startup Marries In-office Catering with Recurring Revenue Model

https://www.forbes.com/sites/matthunckler/2017/06/08/food-tech-startup-marries-in-office-catering-with-recurring-revenue-model-to-surpass-3-million-arr/#1c8cfc2f2964

Team Members

Thomas DeSouza, Matthew Nadherny, Patrick Rice, Samuel Spletzer

Pitch: Point-to-Point

A smart marketplace for smarter travelers

Problem/Opportunity

According to Bond Brand Loyalty, there is $100 billion worth of unclaimed loyalty points. According to another loyalty research firm, Colloquy, about $48 billion worth of loyalty points and rewards are earned each year, of which approximately 33% will never be redeemed.

Many customers are unaware of their points balance or what their points can purchase. Hence points accumulate and expire, and customers lose incentives to stay loyal to brands. For companies, even though unredeemed points are a large source of frequent flyer program profits, research shows that customers who redeem points are more likely to display greater engagement and work harder to earn the next reward. A positive redemption experience can drive members to continue to spend with a brand.

While some customers might be interested in transferring their points or redeeming them on behalf of others, there is currently an institutional void borne out of what economists refer to as the hold-up problem and a lack of trust between any buyers and sellers.


Solution

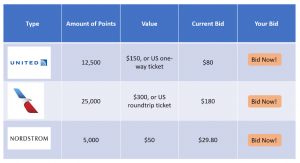
To fix the problem of unused points balances, we create a two-sided marketplace where “sellers” can post how many points they have for which program, and “buyers” can bid on the points they want. Once the auction closes to the highest bidder, funds will be held by the platform in escrow, and the seller will then utilize the points according to the buyer’s wishes (ex: United flight from NY to SF). Upon the buyer’s receipt, funds will flow to the seller.

In this first iteration, we enable sellers to book travel for buyers. Most current loyalty programs do not allow for free transfer of points between individuals; thus, until this program changes, buyers and sellers will need to communicate to ensure that sellers book itineraries correctly. Although there is nothing to prevent customers from doing this already, our platform provides value both by improving discoverability of these opportunities and solving the problem of buyer and seller trust by holding payment in escrow until delivery is verified.

Over time as more loyalty programs enable free transfer of points, our marketplace can accommodate more situations. For example, for sellers with too few points to be of much use, we can allow them to auction their points directly. Buyers can accumulate points from multiple sellers and earn otherwise inaccessible rewards. Eventually, with enough liquidity, our platform can add further value by matching blocks of points to satisfy arbitrary trades, in the same way securities exchanges match bids and asks.

As Point-to-Point grows, it will not only benefit from cross-side network effects, but also open up additional product and business opportunities. As the platform collects data from transactions, we can build a recommendation engine to highlight deals for specific customers. We will also utilize algorithms to educate sellers on points required to cross more valuable thresholds. For example, if a seller had 1489 points with Chase, the algorithm could list shops that the seller would be interested in that could also yield a high return point value, enabling that seller to cross the threshold and sell their 1500+ points for a higher amount. Our platform will also collect relevant data outside the marketplace (ex: new credit card bonuses, 5x points on certain categories, etc.) and distribute this information to members so that they can have a one-stop shop for all loyalty point programs. This will induce stores to participate in our program, as our algorithms can enable higher spending and more efficient advertising.

We intend to monetize through a commission-based revenue model. For trades in which points are paid for in cash, Point-to-Point would collect a 3-5% fee on the transaction amount. For trades in which points from one program provider is exchanged for those of another, Point-to-Point will not collect any commission. This incentivizes more buyers (and therefore, sellers) to use the platform, creating benefit for all.


Pilot/Prototype

Our initial pilot sets up partnerships with loyalty programs that have a wide network of points and already have transfer systems in place, such as Starwood Preferred Guest, Chase Ultimate Rewards, or American Express Membership Rewards. These points can already be redeemed in a variety of settings (hotels, flights, and online retailers) and can sometimes be shared between household members.

We can market Point-to-Point to the popular points forums, including The Points Guy and Reddit, who in general capture a market that is more likely to be motivated by points programs. In line with what Eisenmann, Parker, and Van Alstyne recommend in their article “Strategies for Two-Sided Markets,” we would subsidize early adoption and adoption by price-sensitive users, and work to secure “marquee” users’ exclusive participation with loyalty programs. To incentivize early adopters, we can subsidize transactions for buyers and provide bonuses to sellers.

Furthermore, we will induce further loyalty through discount referrals. To ensure that new entrants do not steal market share, we would form temporary exclusive contracts with participating programs as well as offer our own form of points (earn points to redeem for percent discounts on trades). Over time, we will expand to more loyalty programs, offering an enormous selection for users.


Validation

To ensure our solution meets its objective of creating a liquid market for rewards points while benefiting both points programs and users, we would focus on empirical measures of market liquidity, such as those proposed by Gabrielsen, Marzo, and Zagaglia like liquidity ratio, turnover ratio, and variance ratios. We could also measure the following product success metrics:

  • Number of Sign-Ups
  • Retention Rates (e.g., 7-day and 28-day return rates, DAU, WAU, MAU)
  • Usage Per Member (e.g., # of trades and volume executed)
  • # of Referrals
  • Increase in Engagement with Loyalty Programs


Competitors

Although loyalty programs have become a differentiating feature, allowing companies to win repeat customers and gain market share, the concept of a secondary market where buyers and sellers are matched based on factors, such as  willingness to pay, is still relatively new. Currently, Giift is a loyalty programs and gift card network, allowing consumers to track and exchange points from program issuers (airlines, hotels, retailers, etc.) with one another. However, the “exchange rate” is dictated by Giift (not what the market will bear) and given that only points are exchanging hands, not cash, this limits what a consumer would be able to receive and thus, overall trading activity.

The only other company taking a similar approach of creating a two-sided market platform is Digital Bits. By tokenizing points accumulated with an airline and allowing customers to redeem them for cash or rewards at another rewards provider of their choice, Digital Bits is creating a blockchain-based market and along with it, more flexibility for users. We feel that our solution can successfully compete with Digital Bits because it facilitates communication between buyer and seller without requiring integration with a brand’s existing app or interface. We are also skeptical of the incremental value a blockchain framework provides relative to the additional usage and development complexity it requires. As such, we feel our first-mover advantage and initial user base can perpetuate adoption on both sides of the market.


Sources

https://medium.com/@dfcatch/loyalty-myths-is-breakage-good-873950da26dc

https://martechtoday.com/digitalbits-launches-open-source-blockchain-based-marketplace-loyalty-points-212706

http://techcompanynews.com/loyalty-marketplace-gift-track-reach-100000-loyalty-programs-technology-platform/

http://abovethecrowd.com/2012/11/13/all-markets-are-not-created-equal-10-factors-to-consider-when-evaluating-digital-marketplaces/

https://medium.com/@jgolden/four-questions-every-marketplace-startup-should-be-able-to-answer-defb0590e049

https://www.crunchbase.com/organization/raise-marketplace

https://www.crunchbase.com/organization/cardpool

Eisenmann, Thomas, Geoffrey Parker, and Marshall W. Van Alstyne. “Strategies for two-sided markets.” Harvard Business Review 84, no. 10 (2006): 92.

Gabrielsen, Alexandros, Massimiliano Marzo, and Paolo Zagaglia. “Measuring market liquidity: An introductory survey.” (2011).


Team

Siddhant Dube

Eileen Feng

Nathan Stornetta

Tiffany Ho

Christina Xiong

Hidalgo: Buy Better, Buy Smarter

Opportunity:

Our software application will provide prospective car buyers with a better informed and more cost efficient method of selecting the perfect vehicle for them. Hidalgo is a customer profiling platform that partners with insurance companies in order to determine what specific vehicle a consumer should seek to purchase by taking into account tracked data points that insurance companies collect on their insured customers. Given annual vehicle sales of $17M in 2016, there is a huge opportunity for Hidalgo to come in and remove some of the friction involved in the current sales process. Many individuals do not have a strong foundation of knowledge with which to purchase vehicles. As such, many individuals may be buying cars that do not fit their driving style or make emotion based purchase decisions. By removing some of the friction of uninformed purchasing, we hope to boost sales for manufacturers, save costs for buyers, and reduce claims for insurance companies.

Solution:

By taking the data points such as average driving speed, make and model of car, and braking behavior, we can build a large database of driver types and vehicles. For example, if an individual fits the category of a hard braker who likes to drive fast but never has an accident, Hidalgo would recommend a high performance car that fits this specific profile. It would not recommend a slow Volvo. This match process also allows the consumer to save on insurance when they purchase a car that the  insurance company has recommended, a car that matches the individuals driving style leading to safer driving. The more a car fits an individual’s driving style, the less surprises there are while driving resulting in less accidents. Less accidents means less claims processed by insurance companies, allowing them to save substantially on claims processing. The increased saving is then passed partially on to the consumer reducing their car insurance payments.

Effectiveness, Commercial Promise, and Competition:

For individuals who are price sensitive, the promise of lower insurance payments on their car can greatly impact their car purchasing decisions. Additional savings will result from reduced repair and maintenance costs as individuals’ driving style will better match the vehicles physical components. Individuals will also be able to create a profile and add in their vehicle and style preferences allowing them to choose without feeling like they’re being forced to buy a car.

There is quite a bit of commercial promise due to the large size of  the car buying and insurance industry. Insurance companies can maximize their returns by having to spend less on claims processing, which frees up capital to be deployed elsewhere. Car manufacturers benefit by producing cars that better match the buyers in their target markets and segments and boost sales. Hidalgo will earn revenue by taking a portion of claims processing savings as well as a portion of referral fees from a manufacturer when an individual buys a car through our platform.

The platform’s main competitor will be in house data teams of each insurance company. We believe we can avoid competition through the advantage of data collection across different insurance companies and standardization of data within the Hidalgo platform. This allows insurance companies to reduce their own tech development costs while having access to a larger set of data, making the recommendation software smarter and more accurate.

Suggestions / Improvements:

  • Improved accuracy of recommendations over time as data set grows
  • Improved connectivity so user accounts can be linked via bluetooth to onboard computers within any car
  • Partner with car producers to create more sensor points on a car that can be used to inform buyers’ decisions

Sources:

https://www.edmunds.com/car-buying/10-steps-to-finding-the-right-car-for-you.html

https://www.supermoney.com/2018/01/average-cost-car-accident-pay/

https://www.iii.org/fact-statistic/facts-statistics-auto-insurance

https://www.gq.com/gallery/the-gq-car-buying-guide

https://blog.joemanna.com/progressive-snapshot-review/

Team Members:

Pavlina Plasilova, Kelly de Klerk, Yuxiao Zhang, Aziz Munir, Megan McDonald

Duffle

Opportunity:

Travel and tourism is a huge sector, with direct contributions of $2.57 trillion to the global economy in 2017 and total contributions of $8.27 trillion [1]. Travel agencies (including companies such as Expedia and Priceline) generated $40.5 billion dollars in 2017, with annual growth of 5.3% from 2012 to 2017 [2]. Given the size of this industry, even small improvements in helping consumers decide on and book travel arrangements would have a huge impact. Many consumers are looking for more tailored and personalized recommendations. Yet as the amount of options and information on travel increases, it becomes ever more time consuming to sift through all of the possibilities to find the unique and perfect fit for any given individual. This creates a large opportunity to go beyond the traditional and old-fashioned ranking systems.


Solution:

Duffle is a response to the increasing demand for unique experiences. It facilitates travel discovery and booking by analyzing personal preferences (stated and based on past reviews), airline, restaurant, car rental, tourist activities, weather, and social media data. AI-powered chatbots consider budget, frequent flyer and other reward membership information, location, and availability. Users are able to swipe left or right trip and activities recommendations. The algorithm learns over time from the user response to recommendations and can improve them when users input personal information such as pet or kids joining for the trip. Fellow travelers can also be added to a trip so Duffle and not the main user is the Q&A point for all people on the trip. For solo travelers, Duffle can connect users to other travelers considering the same destinations and dates.


Once a trip is booked, Duffle compiles a list of recommended attractions or activities and historical information about sites the user can visit. The service includes automatic check-in, 24/7 travel assistance app, and on the ground guide.


Duffle assists users past the initial booking by providing packing list recommendations, local sim card options, or advice on recommended vaccinations. It can also alert to security concerns or unfavorable weather changes and offer quick assistance with rebooking. The platform benefits from network effects on the client side since the algorithm learns from the likes and dislikes of the specific user and those of other similar users and can connect travelers with similar interests, budget, and desired travel dates.


Pilot:

Our pilot would require the initial aggregation of source data needed for the curation algorithm. Thus, we would begin to create the network effects within the university format at the University of Chicago or University of Illinois at Chicago (or any comparable university) that have a population of active social media participants that engage with rich multimedia content which can provide travel preference data. We would initially pool this data to create curated content which our data scientists and travel agent partners would initially evaluate for relevance and feasibility. After 2-3 months of the aggregation process, we would look to merge the data and algorithmic learnings to create a machine learning software that can input new data sets, curate existing ones, and accept continuous inputs that will allow it to learn continuously.


Post this initial data collection and curation period, we will engage our university volunteers in person and present them our recommendations. We will conduct online surveys and in-person interviews to gauge their WTP for the trips recommended to them and their relative interest levels. Additionally, we will compare our recommendations vs those of our competitor set (see below), using the data we collect on the student’s interests, geography, and finances. We would also have them rate their interest levels relative to our recommendations and those of competitors on a blind basis.


While the student population is ideal to begin with, they have limited income levels and travel abilities. We would lastly roll out this final pilot stage to all members of the university (faculty, staff, etc.) in order to maintain a comprehensive set of age and income ranges for our algorithm that encompass all market segments. We will look for our pilot to confirm/negate our hypothesis that our recommendation platform with be 1) more robust and comprehensive than competitors, 2) more thorough in its presentation, 3) provide more value for each budget, 4) have a higher probability of booking than competing platforms.


Competitors/Risks/Feasibility:

Currently, there are various companies offering services that Duffle will offer, but none that have successfully combined the data that we plan to combine, and utilized artificial intelligence to optimize the service. Hopper, a discount flight platform, has launched an “AI driven travel agent” that allows users to input preferences about their ideal trip (i.e. duration, time of year) and get recommended flight deals. The platform learns from which deals the user does or does not accept. We plan to utilize AI in a similar way, but through connecting a user’s social media and allowing for more preference information, can offer a more customized result, beyond just flight deals. Mezi, a corporate travel website acquired by American Express, uses AI to learn about a traveller with every additional trip – when they book, what type of ticket they prefer, etc, and provides a platform for booking and managing work travel. Our goal is to provide a similar platform for booking and managing consumer travel and combining it with recommendations for activities, hotels, etc while on the vacation.  


While feasibility of the product is reasonable given we have seen companies utilize different aspects of the technology, and are just looking to aggregate these features, there are risks associated with Duffle. Travel is a popular industry with many companies looking to disrupt or own the booking and planning process. Given that, we will need to rely on network effects and push marketing while continuing to innovate and improve the product.


Sources:

[1] World Travel and Tourism Council. Total Contribution of Travel and Tourism to the Global Economy from 2006 to 2017. Reported through Statista.


[2] IBIS World Industry Report. Travel Agencies in the US. September 2017.

http://www.hopper.com/corp/announcements/hopper-can-now-predict-where-youll-want-to-go-on-vacation

https://mezi.com/

Team Members:

Sam Steiny

Rosie Newman

Gergana Kostadinova

Javier Rodriguez

Personalized travel app

New Opportunity:

International spending by Chinese tourists has skyrocketed in the past 8 years, showing increases of over 150% from $38B to $261B with the growth of the Chinese middle class.  The tourism market is currently very fragmented, as would be expected due to the number of countries and people involved, there is an opportunity to integrate. Traditionally, Chinese tourists travel with their families or through travel agencies that offer group tours. Due to the data capabilities and market share of major Chinese companies such as Tencent and Baidu, we believe there is a chance for them to quickly disrupt the tourism market by offering personalised recommendations and trip planners using prediction models as well as matching algorithms.  


AI Solution:

AI and machine learning techniques will be used to create a powerful trip planner and recommendation tool that is personalized to individuals. Building off the kind of matching techniques that are used by platforms such as say, Netflix, machine learning can play a large part in the recommendations section. The AI solutions will be powered by continuous real-time data through surveys, reviews and location tracking. Therefore, the application will identify travel-companions and restaurant recommendations by overlaying these techniques on top of traditional filtration tools specified by the users. The solution required must be able to combine different kinds of data types, for example users may have an image of a tourist spot with a comment about how much they loved it, therefore the company would need to apply image recognition techniques. This could be combined with multiple searches in the week prior to travelling on the Baidu search engine, for best restaurants in a certain district of a city. Thus, combining and profiling using such data would create an optimal route and itinerary for the traveller.


Design of Demonstration:


To understand the commercial promise, we must focus on the pain points of customers and see how the product addresses these. One of them is logistics and excessive paperwork to track all kinds of reservations, compounded for families. With the centralized dashboard (pictured below), these can be compiled in one place, and this can be done through automatically pulling data from e-mail and other communications. A proof-of-concept has already been offered by Google on its Trips app.

Another pain point can often be the recommendation system. Younger travellers often want to skip the touristy spots and go somewhere authentic. This is often not possible due to the language barrier, but by utilizing crowdsourced recommendations (already a part of these companies’ infrastructure) and filters, it will be easy to save time and money finding suitable places.

Pilot:

We have talked about many features, so a pilot would focus on rolling out some core features in a few cities. Say, we pick Paris, a popular tourist destination with a lot to see and a language barrier for most. We would beta test with young travellers going to Paris, and initially propose itineraries and recommendations based heavily on crowd-sourced data and location tracking. In this service, the main user is not the main source of revenue, and thus we would have to focus on user experience. As more users are attracted to the platform, there would be various ways to monetize, the most popular of which we foresee as being a B2B model, where businesses are charged for giving deals to travellers and advertising on the platform. Moreover, as travellers take multiple trips, machine learning techniques can be employed more heavily to solve prediction problems related to planning itineraries and suggesting establishments.


Sources:

https://www.emarketer.com/Article/WeChat-Users-China-Will-Surpass-490-Million-This-Year/1016125

10 Most Popular Social Media Sites in China (2018 Updated)

https://www.wsj.com/articles/internet-tightens-popular-chinese-wechat-app-to-become-official-id-1514541980

https://www.chinadaily.com.cn/specials/0711mafengwo.pdf

Google launches a personalized travel planner, Google Trips


Team Members:

Mohammed Alrabiah

Tuneer De

Mikhail Uvarov

Colin Ambler

Lindsay Hanson

Profile on the National Residency Match Program

Challenge:

In 1952, the National Residency Program (NRMP) was established as a non-profit organization to match medical students and residency programs. However, by the 1990s, the system was under serious strain. With thousands of students attempting to match across dozens of specialties and thousands of residency programs, there was concern that hospital preference was favored over that of applicants’. Further, more applicants were trying to match as a couple, something the current system could not handle, causing students to opt out of the process. The NRMP hired Al Roth to design an algorithm that would lead to more desirable outcomes and encourage applicants to opt into the process.

Solution:

Today, the NRMP uses Roth’s adaptation of the Gale-Shapley algorithm to produce “stable” matches, that ultimately favor applicants. It considers their preferences first, then the hospitals’. It also can do joint matching for couples. Beyond residency programs, this algorithm has applications from matching students to public high schools in NYC and to organ donor matching. In 2012, Alvin Roth and Lloyd Shapely won a Nobel Prize in economics for the algorithm’s application across markets that require choice from both sides of the market, and where price is not a factor.

The algorithm works by having both students and hospitals rank their preferences after an interview process. Both applicants and hospitals simultaneously submit their preferences in rank order. Then, the algorithm considers the first student and determines if that student has ranked a given hospital, if not, it moves on. If she has ranked the hospital, then the algorithm determines if the hospital has ranked the student. If so, then they are “tentatively matched”. The algorithm goes to the second student, looking at the same hospital. If it is a mutual match, then it determines 1) if the hospital has a spot remaining and 2) if the ranking is higher or lower than the previous student already “tentatively matched”. If higher than the previous match, then the previous match is demoted. If not, and all spots are filled, then the algorithm considers the student’s second choice. This process occurs across dozens of specialties, thousands of global applicants and thousands of residency positions.

Results:

In 2017 Match, 30,478 students matched, or ~71% of registrants, an all-time high. Unfilled positions were placed in the Match Week Supplemental Offer and Acceptance Program, ultimately leading to a 99.4% fill rate. Couples are increasingly satisfied with the new algorithm – 95.4% matched in 2017. The previous methodology would not have been able to handle this volume and level of complexity at this speed, about 17 seconds. Literature exists to refine the algorithm, but there are no commercially viable alternatives as most agree with the “stable marriage” approach to this process. Considering how adaptable the algorithm is, it is unlikely any competing approach will exist in the short-term.

Opportunities:

The process is imperfect. Both students and hospitals attempt to influence the other party’s rankings by over-embellishing their true preferences. Trust in the process and concerns about whether applicant preferences are taken into account remain.

To maintain trust, the NRPM is not currently changing the algorithm. However, there are other methods of engendering trust – such as continuing data transparency. In not adjusting the algorithm, the NRMP loses any opportunity to improve upon it. Significant time and money is also spent in the interview process itself.

This algorithm could be expanded to other industries that have many companies with similar offerings targeting a specific pool of candidates. Example industries are investment banking, consulting, and law. This process could also expand globally, for example NRMP has licensed the algorithm to the Canadian Resident Matching Service. It also could be used for other professions such as matching law students to firms, though Dr. Roth indicated this only would work if there was a demand for a market to be created.

This type of algorithm could be used in any two-sided market with uncomplicated preferences (firms or people or a combination of both) and where money is not a deciding factor. Evolving the algorithm to handle complicated preferences is necessary to further commercialize to other markets where price is not a reasonable arbiter to set supply and demand.

Sources:

https://www.carms.ca/en/residency/match-algorithm/

https://www.ncbi.nlm.nih.gov/pmc/articles/PMC3399603/

http://www.nrmp.org/about-nrmp/

http://freakonomics.com/2015/06/17/110307/

http://www.nrmp.org/wp-content/uploads/2017/06/Main-Match-Results-and-Data-2017.pdf

https://web.stanford.edu/~alroth/nrmp.html

https://jamanetwork.com/journals/jama/fullarticle/195998

http://www.nrmp.org/wp-content/uploads/2017/09/Applicant-Survey-Report-2017.pdf

https://www.forbes.com/sites/theapothecary/2014/04/15/how-a-nobel-economist-ruined-the-residency-matching-system-for-newly-minted-m-d-s/#91dbc3055850

https://www.forbes.com/sites/theapothecary/2014/05/27/the-real-problem-with-medical-education-isnt-the-residency-matching-system/#6fa0e2ab2433 

Derivative Risk Control – Augmented Judgment

Opportunity:

Financial Broker-Dealers such as Goldman Sachs, JP Morgan, and Morgan Stanley are constantly monitoring their trading activity for errors, particularly in the Over-the-Counter or OTC market, where trades are done off of exchanges and are bilateral agreements between parties with bespoke terms.

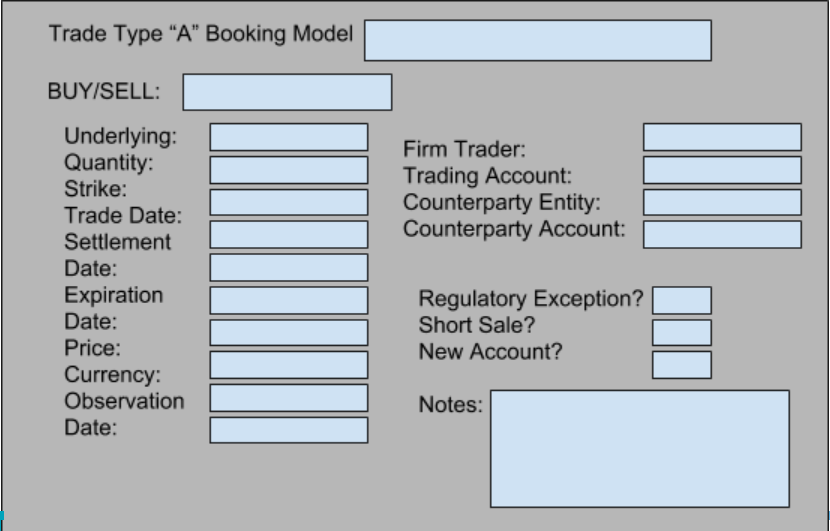
Simple, “vanilla” products such as Calls and Puts may have as many as 15 relevant fields, but structured products and exotic derivatives may have upwards of 100. Each field is negotiated and confirmed with counterparties on the “street” in a multi-level proofreading and verification process that can take anywhere from three days to two weeks or more. Errors on the direction of a trade, the underlying asset a derivative references, the size, strike, or expiration date are all relevant economic factors that can significantly damage the profit margin, reputation, and volume capacity of a given securities business.

It is in the interest of Investment Banks to mitigate the risk they incur within this OTC market by intelligently sensing where potential risk may lie and devoting resources accordingly. However, the current model involves visual, manual reconciliations performed by specialists on an ad hoc, continual basis with each trade, and field, reviewed as it comes.

 Process for Confirming and Controlling OTC Trades Currently:

Generic Sample OTC Option Ticket:


Commercial promise and challenges:

According to the Bank of International Settlements (BIS) the outstanding notional amount of OTC derivatives exceeded $416 Trillion globally, with a gross market value of $13 Trillion.

Utilizing these assumptions as well as error rates and sizes provided by conversations with industry experts we create an estimated total addressable market and assign a value to the potential industry savings annually per incremental improvement in error reduction:

Number of Major Broker-Dealers 25
Average Transactions 100
Market Transactions / Day: 2,500.00
Yearly Transactions: 625,000.00
Gross Market Value: $   13,000,000,000,000.00
Error Rate: 3.0%
Average Value of Error: $                              5,000.00
Annual Error Cost: $                   93,750,000.00

Hence, a reduction in the error rate by 1% and error size by $1,000 would yield annual savings of approximately ~$44mm, whereas a 2% reduction and $3,000 reduction saves ~$80mm. Thus, even a small market penetration rate with moderate success could be significant.

The principal challenge would be in getting Investment Banks, which closely guard their internal affairs, to be willing to integrate an outside vendor’s technology in their operations without having direct control over that entity and in addition having that entity service other banks. Furthermore, the usage of this technology to reduce error rates in an opaque and poorly-understood market, which is the reason for the opportunity in the first place, does not lend itself well to clear-cut spending decisions. Therefore getting buy-in for COO’s and CTO’s will be a lengthy process and require imaginative data visualizations and proof of data security.

Competition:

We face competition on two fronts, internal to Broker-Dealers and externally in the form of “RegTech” companies seeking to provide tailored AI Solutions. Internally, there are significant resources available to banks within their IT departments, however, the deployment of those resources to such targeted AI solutions is limited at current due to the intense product-specific knowledge requirements that are often siloed. Externally, there are numerous RegTech companies which primarily focus on compliance rather than financial risk. AQMetrics and Ancoa, which received the 2016 Operational Risk Award, both are focused on automated auditing of transactional data and real-time trader behavior surveillance. These companies thus pose the greatest direct threat.

Proposed alteration:

Model Design:

  1. Data from email, chat, firm booking systems, issue trackers, integrated in a pipeline to create a dataset for analysis. Historical testing and scenario analysis used to create weightings of risk for fields/attributes.
  2. Using Supervised Learning we will use cross-validation and other techniques to tune hyperparameters on predictive indicators of the risk a particular trade has
  3. We believe this should be constructed as follows:

Risk (1-100) = F(Trader Behavior, Objective Risk)

Trader Behavior = F(Historical Error Rate, Estimated Error Rate)

Estimated Error Rate = F(Trade Complexity, Number of Trades, Time of Day, Experience Level, etc)

  1. Issues will be prioritized based on the risk construct and highlighted for further investigation


The model will create informative risk parameters for each trade that will be incorporated into the prioritization of the item either in terms of rigor of checks (can be automated via email/UI interface) or legacy human-performed checks. Large-significance errors will be disproportionately targeted by the model’s tuning. Long-term, the risk identification process will precede trade booking and help establish a more rigorous booking process at the origin. This will skew control processes to reduce error size and frequency measurably.

Sources:

https://www.investopedia.com/exam-guide/series-65/alternative-investments/derivative-securities.asp

https://www.investopedia.com/terms/o/otc.asp

https://www.bis.org/statistics/about_derivatives_stats.htm?m=6%7C32%7C639

http://stats.bis.org/statx/srs/table/d8

http://www.tearsheet.co/bigger-data/10-regtech-companies-gaining-momentum

http://aqmetrics.com/products/

https://www.crunchbase.com/organization/ancoa-software#section-overview

Mean Error Size and Error rate estimated based on conversations with Operations Professionals from Goldman Sachs and UBS Securities

Feedback App

Feedback logo


Opportunity:

Feedback is a company based in Toronto, CA, that aims to reduce food waste and convert sunk costs to incremental profits for restaurants.  Restaurants have always struggled with minimizing their food waste. Although many have employed different front-end planning methodologies to try to accurately forecast their demand and keep waste low, many still struggle to responsibly dispose of unused cooked food or soon-to-expire ingredients at the end of the day.  Though many choose to donate their some of their remaining food to the homeless and hungry, most non-bread food products are still wasted. The Feedback app gives restaurants the opportunity to sell cooked food that would otherwise be wasted at discounted prices during off-peak hours.

Feedback App


Solution:

The Feedback app is a platform for restaurants to offer customers a selection from their menu at discounted prices during hours of their choice.  Although this is primarily intended for restaurants to sell food that would be otherwise wasted at off-peak hours (i.e. between lunch and dinner or between during late night), restaurant users can choose to offer discounted food at any time (if they wanted to use it as a marketing tool for example).  Hungry customers are able to select from a variety of menu options in their area that fit their preferences for cuisine, price and time frame.

Feedback’s technology does more than pair up restaurants with restaurant-goers.  The application uses algorithms to intelligently determine pricing of the menu products depending on time of day, location, the product itself, the quality of the restaurant, the shelf-life of the product and the parameters set by the restaurant itself.  Although restaurants have the ultimate say in what the pricing actually is, Feedback utilizes the data of all the restaurants in its user base plus additional data from restaurants in the area though scraping menus on websites to provide an accurate pricing recommendation.  As the best pricing off-peak pricing data comes from other users of the platform, Feedback is strongly subjected to network effects.

Effectiveness, Commercial Promise, and Competition:

Overall, we are not sure about their effectiveness as they are still limited to only the Toronto area.  They have signed up over 7,500 users in Toronto alone with over 1,000 meals sold within its first month of operation (October 2017). [1] While this opportunity does help make additional revenue on food that would have gone to waste, restaurant margins are quite low (~ 6% [2]).  So, there is not a lot of margin to be captured by a technology company like Feedback.

There are several companies trying to reduce food surplus through technology, either by providing discounts direct to consumers or by sending surplus direct to organization in need, mostly nonprofits.  For example, Gebni, a NY-based company that has raised $250,000 in funding [3], provides automatic smart menu pricing for its users to reflect real-time demand for that specific item.

Copia, another competitor, allows restaurants to schedule pickups for surplus food.  They then match the surplus, based on the amount and food type, to a local nonprofit.  They also provide opportunities to make better buying decisions and help organization get proper tax deductions.

Another competitive force is better trained staff and improved internal processes to help restaurants to better predict supply and demand for their menu items. That said, there is likely to be some element of unpredictability of supply and demand irrespective of these kinds of improvements.


Suggestions / Improvements / Risks:

To better position Feedback for commercial success, the company should consider implementing the following:

  • Delivery integration to reach more customers.
  • Consider changing brand name to something catchier that’s not a generic word to avoid crowding search results and to make branding easier.
  • Because this business model already has small profit margins, consider limiting or discontinuing donations to non-profit food pantries as the company scales.    
  • Offer promotions to certain restaurants (e.g., new partners) to display their menus more prominently in app
  • Clarify in app how fresh the food item is, to mitigate consumer concerns about freshness

Feedback should also improve its algorithm to

  • Better match discounted pricing with maximum, real-time consumer willingness to pay during off-peak hours in order to extract most value for restaurant partners
  • Identify better restaurant options based on location, consumer preferences, consumer purchase history
  • Narrow pick-up window based on type of food (e.g., pizza can be picked up within 30-60 mins, dozen bagels with 2-4 hours)

Risks:

  • Depending on the target market of the restaurant, the Feedback could open its clients to the risk of cannibalization.  Customers who would normally eat during peak hours at full price could be converted to off-peak users.


Sources:

[1] https://www.feedbackapp.ca/single-post/2017/11/01/What-A-Month-It-Has-Been

[2] http://smallbusiness.chron.com/average-profit-margin-restaurant-13477.html  

[3] https://www.crunchbase.com/organization/gebni#section-overview

https://foodtank.com/news/2017/08/food-waste-technologies/

https://www.feedbackapp.ca/about-us