
Article rating: Archaeology, Intermediate

Samantha Suppes
Ph.D. student
Near Eastern Languages and Civilizations (NELC), University of Chicago
Tel Shimron Grid 92, Square 87, 2017-2019
The Tel Shimron Excavation (Israel) began in 2016 under the directorship of Dr. Daniel Master and Dr. Mario Martin. Tel Shimron is a multi-period site in the north of the country, sitting between the Sea of Galilee and the Mediterranean Sea. Continuously occupied since the Neolithic Period, this tell boasts remains of a Bronze Age fortification, a ritual bath and monumental architecture at its highest point.
I began working at the site in 2017 as a square supervisor in Square 87 of Grid 92. This area is located along the southwest edge near the Bronze Age wall and city gate and has yielded significant finds from the 1920s and 1930s, the Hellenistic Period and most notably the Middle Bronze Age. In the Middle Bronze Age, this is where common people lived. We have found remains of several small structures as well as an earlier courtyard. The structures were very confusing during excavation as they seemingly followed no pattern and had walls added haphazardly over time. Keeping track of the walls and surfaces was difficult but a Harris matrix was critical for understanding this space and how it developed. Each wall, pit, layer of sediment or other feature was given a unit number and plotting these units on a Harris matrix chronologically illustrated how the layers and walls built up.
OCHRE’s Visualization Wizard, the VizWiz, supports the creation of Harris matrix diagrams for displaying stratigraphic sequences and other relationships, based on the principles outlined by Edward Harris, and drawing on core OCHRE data. This feature is uniquely appropriate to archaeology projects.
Consult the OCHRE Wiki’s Visualization article for more information about this feature.
Preparing the Data
Establish stratigraphic relationships in OCHRE
The stratigraphic relationships between excavation units (perhaps called a “locus” at other sites) are established in each unit’s Properties tab. Here the user can record which other unit(s) each unit is immediately earlier than, later than, equal to, abuts, etc., using OCHRE’s relational properties in the usual way.

OCHRE: relational properties among stratigraphic units
Establish Phases
Before a matrix can be created, phases for the site or the area in question must be established in the Periods category. Likely, the periods and phases for the site will already exist in the Periods hierarchy under a name like: “<project_name>: Phases,” i.e. “Shimron: Phases”, or some other primary Period hierarchy. Period values are used to chronologically categorize an excavation’s grids, squares, units/loci, etc., and they can be contextualized within broader historical or cultural periods. But when creating a Harris matrix it is preferable to have a separate hierarchy of phases under Periods to use specifically for this purpose. This will give the user making the matrix more control over what periods and phases are used and how they are divided, and most importantly it will not interfere with the official phasing and periodization done by the site director(s) and other staff. This hierarchy of phases can be called a Matrix Phase Hierarchy.
This hierarchy should be created before trying to build a Harris matrix and it is done through the use of OCHRE’s Copy-item/Paste-item feature. First create a sub-item under Periods by selecting Periods and clicking the “create sub-item” button at the top of the screen. Give the item a name, i.e. <project/site_name> Matrix Phases, and a description. Then, begin to copy and paste phases from the site’s official phases hierarchy, organizing and subdividing them as needed. Make sure to be copying and not cutting. To do this, simply right-click the item to see the options and select Copy-item. To paste, select the name of the hierarchy value where you wish to put the item, right-click and select Paste-item. Groups of phases can be created by selecting the new matrix hierarchy and creating sub-hierarchies using the “create sub-item” button.
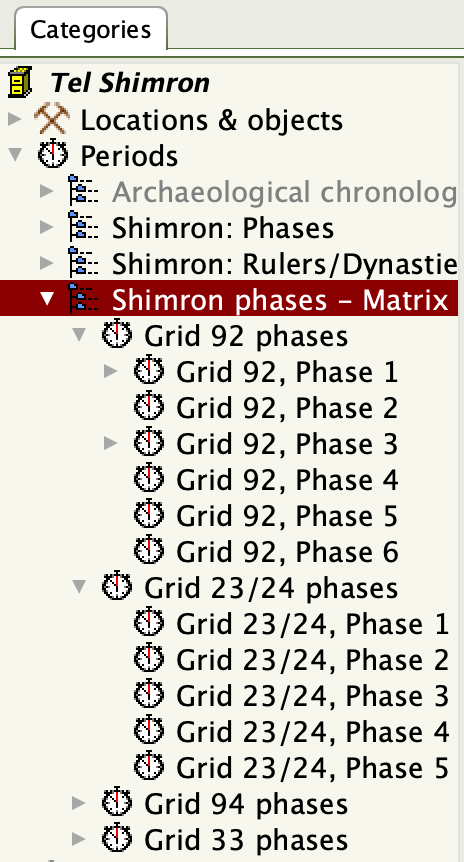
Excavation Phases, organized for use in a Harris matrix
Preparing a Query/Set
Harris matrices are made by first compiling the relevant units/loci into a single list. This is done by adding a Query to the Queries Category of an excavation’s OCHRE project. To make a Query, click the “insert new sub-item” button once the Queries category, or a folder within it, has been selected. A new item option will appear; select the Query option when prompted (rather than the Heading option). The Query should then be given a Name. In this query’s Scope tab, select the current project by checking the box beside it. Then in the Category tab, select “Locations & Objects” from the drop-down list. A hierarchy will appear; choose the appropriate selection of units within a square(s) and/or grid(s) (or equivalent). In the Properties pane of the Criteria tab (beside the Scope tab) click the “new sub-item” button presented there. Under “Variable” select “Location or object type.” Under “Operator” select “is.” Under “Value” select “Stratigraphic unit” (or equivalent). Click “Save” at the bottom and click the “x” next to Properties to turn it into a check mark. This activates the Properties criteria.
The query can now be performed by clicking the Perform query button. The results of the query may be used to create a Harris matrix directly (from the quick-view toolbar), or saved to a Set and then be used to make a matrix. For maximum flexibility it is best to use the Set option. Click the Save results tab and the button of the same name. The items in the Query Results list can then be found saved in a Set in the Inbox of the Sets category.
Creating the Harris Matrix
After the Query has been performed, and the results saved as a Set, close the Query Results tab and click the Set’s View tab at the top. From this View, click the button that looks like a bar graph called “View items collectively in Chart view.” [Note that the Visualization Wizard is also available via this same button on the quick-view toolbar of the Query Results pane, but the quick-view option is for on-the-fly visualizations and does not allow for saving specifications.]
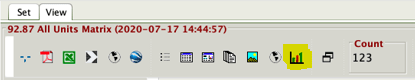
Set toolbar with Chart option
This activates OCHRE’s Visualization Wizard. In the Type tab, choose the Harris Matrix option.

VizWiz, Harris Matrix option
Format Options
Select the Content tab, and within this, the Format tab. In the Format Specification pane the user can establish a uniform style for how the items will appear on the matrix in the Styles tab, and the style of the text/label in the item in the Labels tab. The user may also override these settings in the Override tab if it is desirable for various items to be displayed using different styles. To do this, see the Appendix: Creating Styles for Items below.

Harris Matrix Format Specification
Relations
In the pane called Relations, select appropriate options from the first two drop-down lists. The first option will establish the vertical relationship of the units/loci on the matrix. In “Before/After”, select “Immediately earlier than/Immediately later than” (or an equivalent) to establish which relationship is used to relate items as temporally before and after each other. The second option will establish the horizontal relationship on the matrix and so in “Correlated,” select “Equals” (or an equivalent) to establish which items are the same/correlated. Refer to the guidelines by Harris himself for further information regarding these types of relationships. Note that these relationships must be of the auto-inverse type, that is, relational properties that are automatically bi-directional (introduced in OCHRE in early 2019).
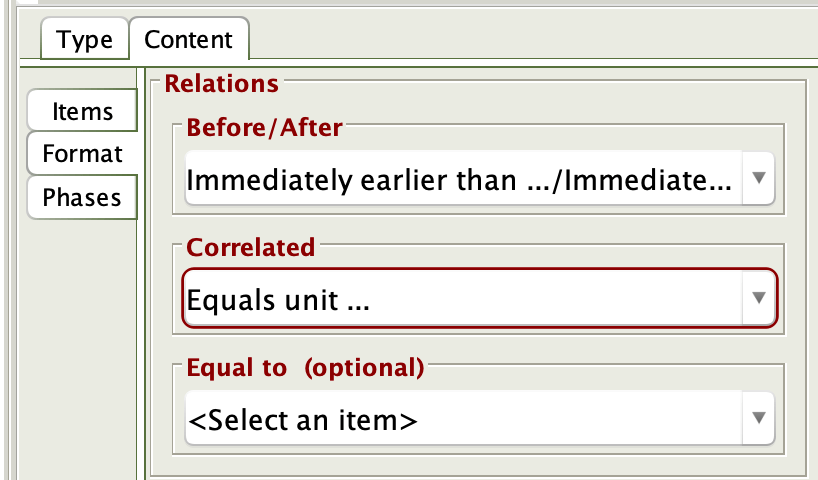
Harris Matrix, establish relations
Phases
For this step, select the Phases tab. Here the hierarchy of phases that will govern the Harris matrix’s structure is selected. Choose the hierarchy created for this purpose (see Establish Phases above) in the drop-down list. There is also an option to specify an OCHRE Style for phases from the right-hand drop-down list but this is not necessary and this option may remain at <default>. See the Appendix: Creating Styles for Phases, below for further details.
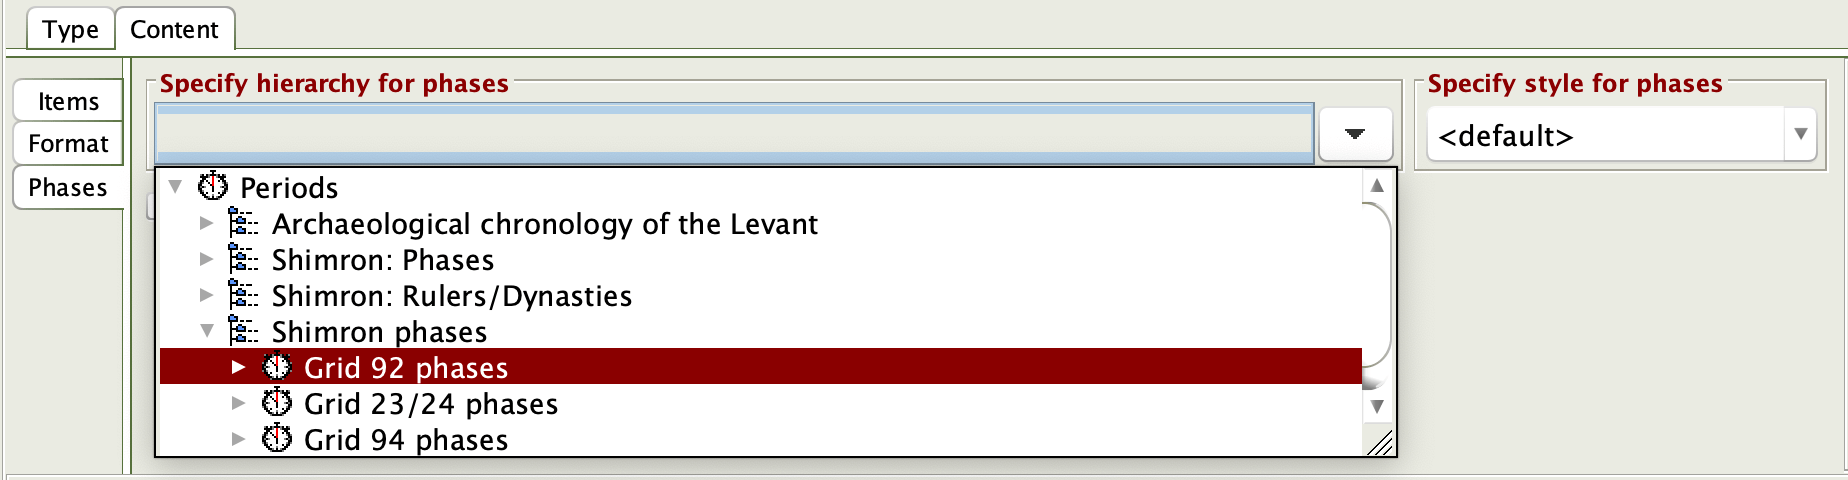
Harris Matrix, apply appropriate Phases
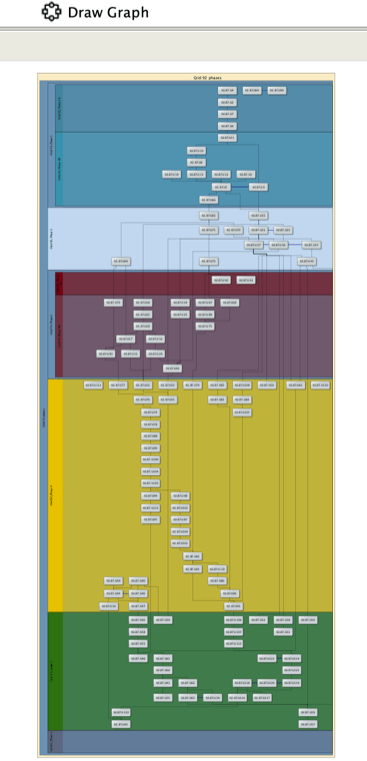
Drawing the Graph
Click Draw Graph to generate the matrix. Use the Save button under the Draw Graph button to save the matrix as a PNG image.
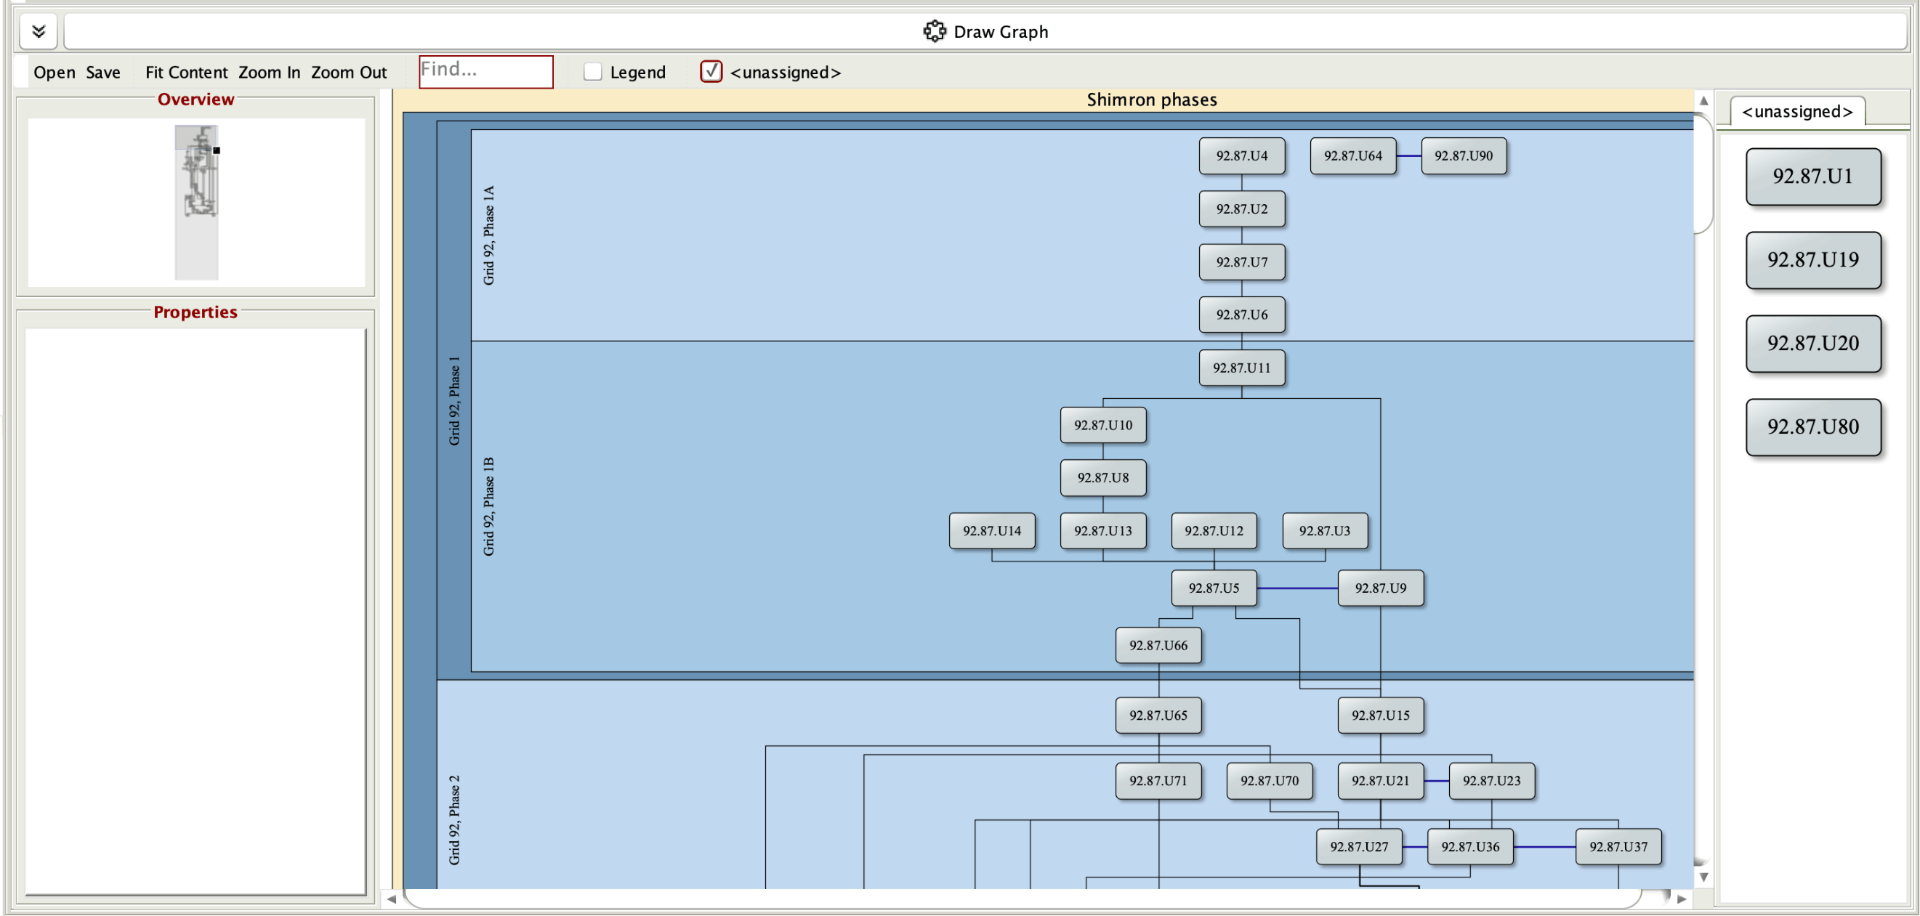
Harris Matrix, Draw Graph
Navigating the Harris Matrix
There are several buttons below Draw Graph that can be used to change the view of the Harris matrix. To see the entire image, select Fit Content. Zoom in and out with the buttons provided, or click the chevron-button beside Draw Graph to get an expanded view pane. Use the search box (Find…) to locate an item on the matrix; this is a character string search that must match exactly the Name of an item in the matrix. By selecting the Legend button, a table will appear on the right-hand side listing the symbols used for the items, based on the assigned styles (see the Appendix: Creating Styles for Items, below for more information on this). The unassigned button will show the user any items that do not appear on the matrix but which were included in the Set or Query Results. These items may need further consideration.
The Overview pane gives the viewer an adjustable zoomed-out view of the matrix to allow for fast, easy navigating if the matrix is large.
The Properties pane gives the user details about each item when selected. It will display the item’s description, relationships to other items (whether those items are present in the current matrix or not), and the item’s assigned Phase. If the units listed as being related to the selected item are colored blue, it means they appear in this matrix. These links can be selected to locate the item—the matrix will automatically shift to center the item in the view. Items listed in black, do not appear in this matrix, but when clicked their item details will be displayed in a pop-up window.

Harris matrix, Properties pane
Interpreting the Harris Matrix
To understand what a Harris matrix is and the general laws that govern its creation, see the Wikipedia article for the Harris Matrix. The matrix created using OCHRE is governed by the same rules and principles described, although with some added features that should be explained.
OCHRE’s Harris matrix feature not only shows the direct vertical and horizontal relationships between units, but also shows them in a more general sense by placing the units in their stratigraphic phases. This makes it easy for a researcher to understand which units date to approximately the same time and how they interact with each other. Typically the chronologically newest phase is at the top of a matrix and the oldest is at the bottom.
The lines that link the items indicate a direct relationship between these units; in other words, in the real world these units were touching in some way.
- Vertical lines indicate chronological relationships, the lower item being older than the higher item. Note that often many units are drawn below a single unit, or only one unit may be drawn below many others, so the vertical lines will often not be perfectly vertical when drawn (that is, they may have bends). These lines are drawn based on the “Before/After” Relation specified as described above.
- Any unit connected to another with a thick, blue horizontal line means that these units are correlated; in other words, effectively the same unit. It regularly occurs that what should be thought of as a single unit is divided into two or more because of practical circumstances on an archaeological dig. Reasons for this can include: the excavator not at first recognizing the units’ similarities, the unit being divided by other features, etc. These horizontal lines are drawn based on the “Correlated” Relation specified as described above.
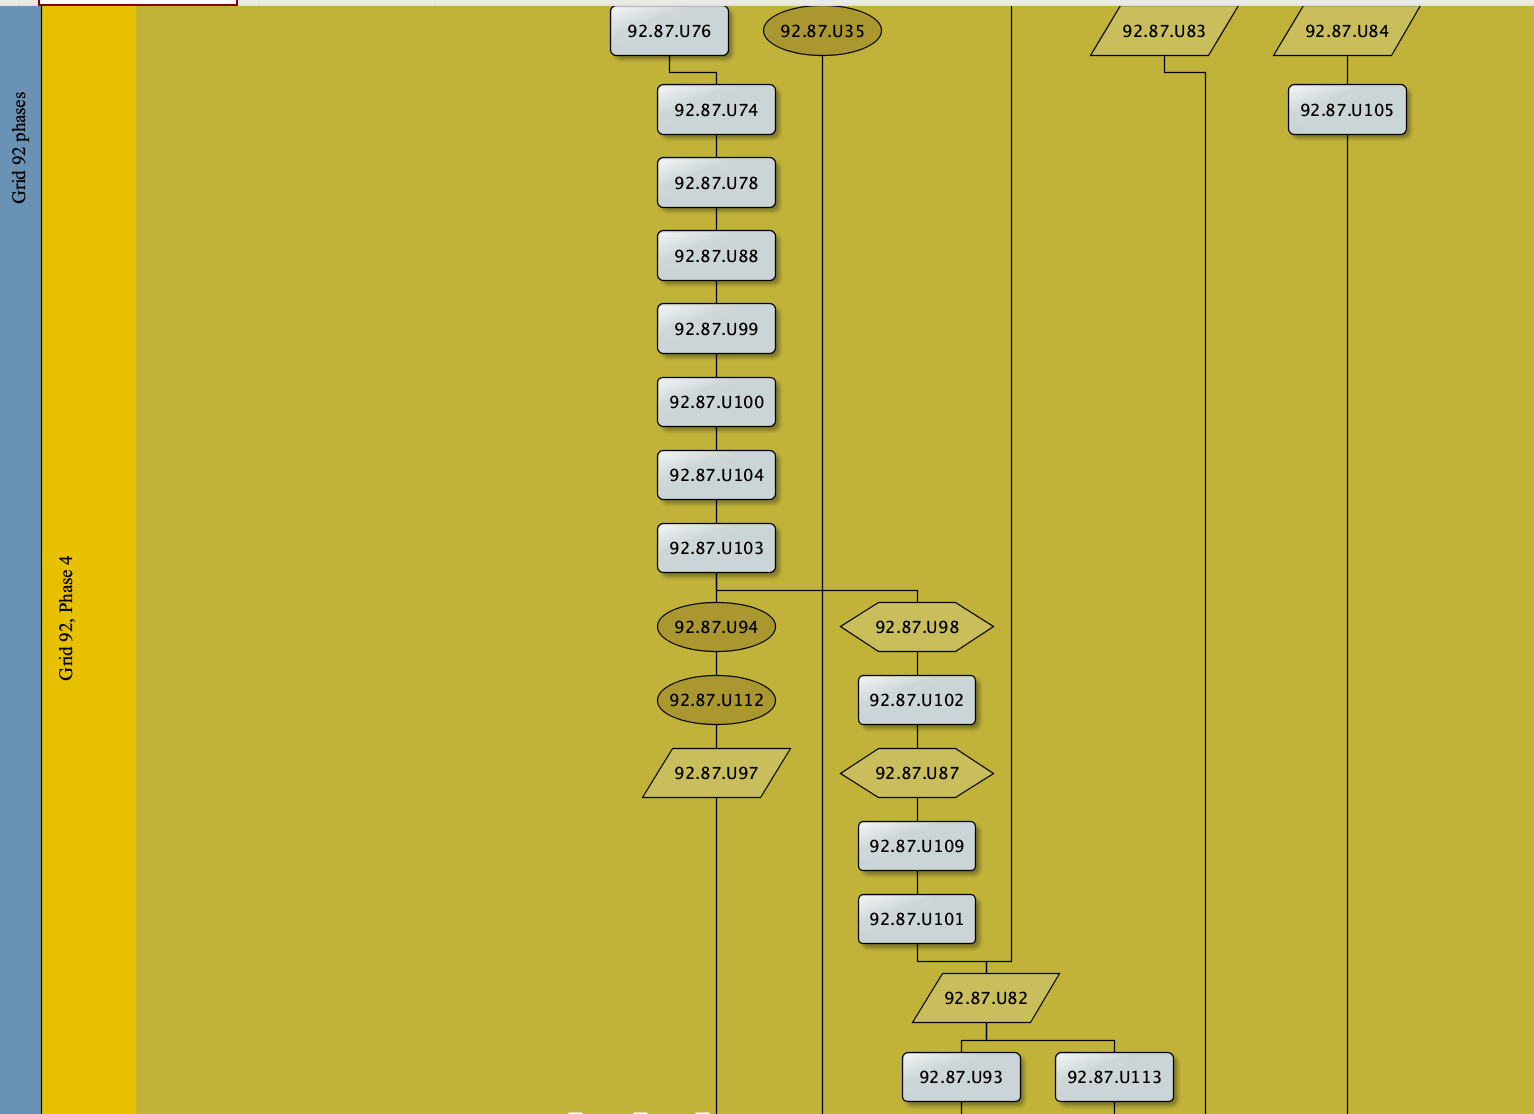
Harris matrix, Example from Phase 4 at Tel Shimron
Example from Phase 4 of Square 87 of Grid 92 (simplified for the purpose of illustration):
In Square 87 of Grid 92, the Harris matrix illustrates the complicated relationships between some Phase 4 units in a way that can be understood. An area along the southern balk was covered by several sediment layers and overlapping pits, among other things. The Harris matrix is able to document the chronological progression of this area (moving from bottom to top). The wall U82 was built at some point in time, then two layers of sediment built up around it (U101, U109), upon which a chalk installation was put (U87), which was then cut into by a pit (U102) and filled in (U101 not seen here). This pit was partially covered by a line of stones (U98), which was cut by a burial pit (U103/U104) that was itself cut by another pit (U99/U100), and upon which more layers of sediment built up (U88, U78, U74). While digging through these sediment layers and identifying the pits and cuts was challenging, the Harris matrix format allows for the chronological relationships to be understood and explained.
Troubleshooting
Issues may arise when confronted with the finished Harris matrix.
- Missing items Some items may be missing from the matrix. This can be determined by selecting the checkbox beside the word unassigned under the Draw Graph button. A panel will appear on the right showing any items not assigned to phases present on the current matrix. The user can then either visit these items’ Properties panes and establish their appropriate relationships with other items or explicitly assign their phase, or drag the items to the appropriate Phase panel on the matrix to make the assignment interactively (coming soon).
- Items appear to be floating or lacking proper relationships with others This can be resolved by visiting these items’ Properties panes to check the assigned stratigraphic relationships.
Note that the Harris matrix is an interactive graph. Double-clicking on any item will pop up its details, including its Properties pane, in a window for viewing or editing (with appropriate access rights).
Appendix: Creating Styles for Items
A user has the option of attributing various styles (different colors, shapes, or text formats) to the items/units shown on a Harris matrix. When making a Harris matrix, it is often the practice to shape each item differently depending on the unit’s type, i.e. foundation trench, deliberate fill, burial, etc. This can be done by selecting the project name at the top of the Categories tab on the left of the OCHRE screen. On the Projects tab, select the Preferences tab under the Name field and within it, the Styles tab. To create a new style rule, select the “create new item” button on the right hand side above the button that looks like a trash can. Give the Style a name and select the Properties tab within it. Select the “Insert new item” button on the Properties toolbar to insert a new row. In the drop-down list under “Variable,” select “Location or object type”; under “Value” select “Stratigraphic unit” (or equivalent). For each stratigraphic unit type to be differentiated, insert a sub-item within the parent row. In the drop-down list under “Variable,” select “Unit type” (or equivalent); under “Value” select the desired unit type.
For example:

Create Styles for Items
Under the third heading “Style” select the desired row and click the bow tie that appears. A new, small window will pop up, providing options to determine what that type of unit will look like by distinguishing the polygon format, line format, point format, text format and shape.
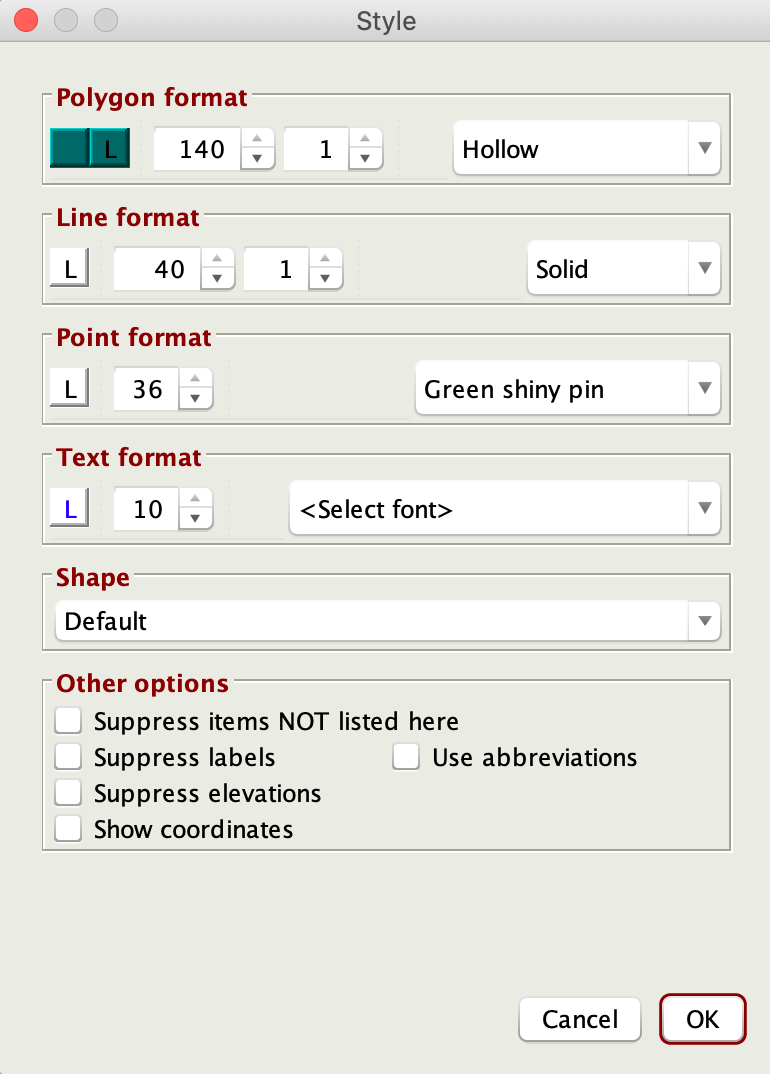
Edit Style
When finished attributing styles to the various unit types, the user may apply these style directives to the items in the Harris matrix by selecting the Style name from the Override drop-down list in the Format tab. OCHRE applies the appropriate shapes and colors to each item and supplies a Legend.

Harris Matrix with item Styles and Legend

Available shape options for Harris Matrices (with thanks to OCHRE consultant Nick Schulte)
Appendix: Creating Styles for Phases
A user has the option of attributing various styles (different colors, shapes, text formats, etc.) to each phase shown on a Harris matrix. You will find your project’s Styles listed under the Sets & Specifications category on OCHRE’s navigation pane (for more information, see this wiki article on Styles). To create a new style rule, select the “create new item” button on the right hand side above the button that looks like a trash can. Give the style a name and select the Periods tab within it, then select the button that looks like a paperclip with a plus sign. The Linked items tab will appear in the right-most pane. Select the desired phases by expanding the appropriate hierarchy in the Periods category.
With the relevant phases selected in the Linked Items pane, click the paperclip with a plus sign button again and the selected phases will be added in the style’s Period tab. Then, by selecting each time period individually one can control the style of each phase as it will appear on the Harris matrix. This is done by selecting the bow tie button on the Periods toolbar. A pop-up window will appear; choose the format of each phases’ polygons, lines, points, text and shapes.
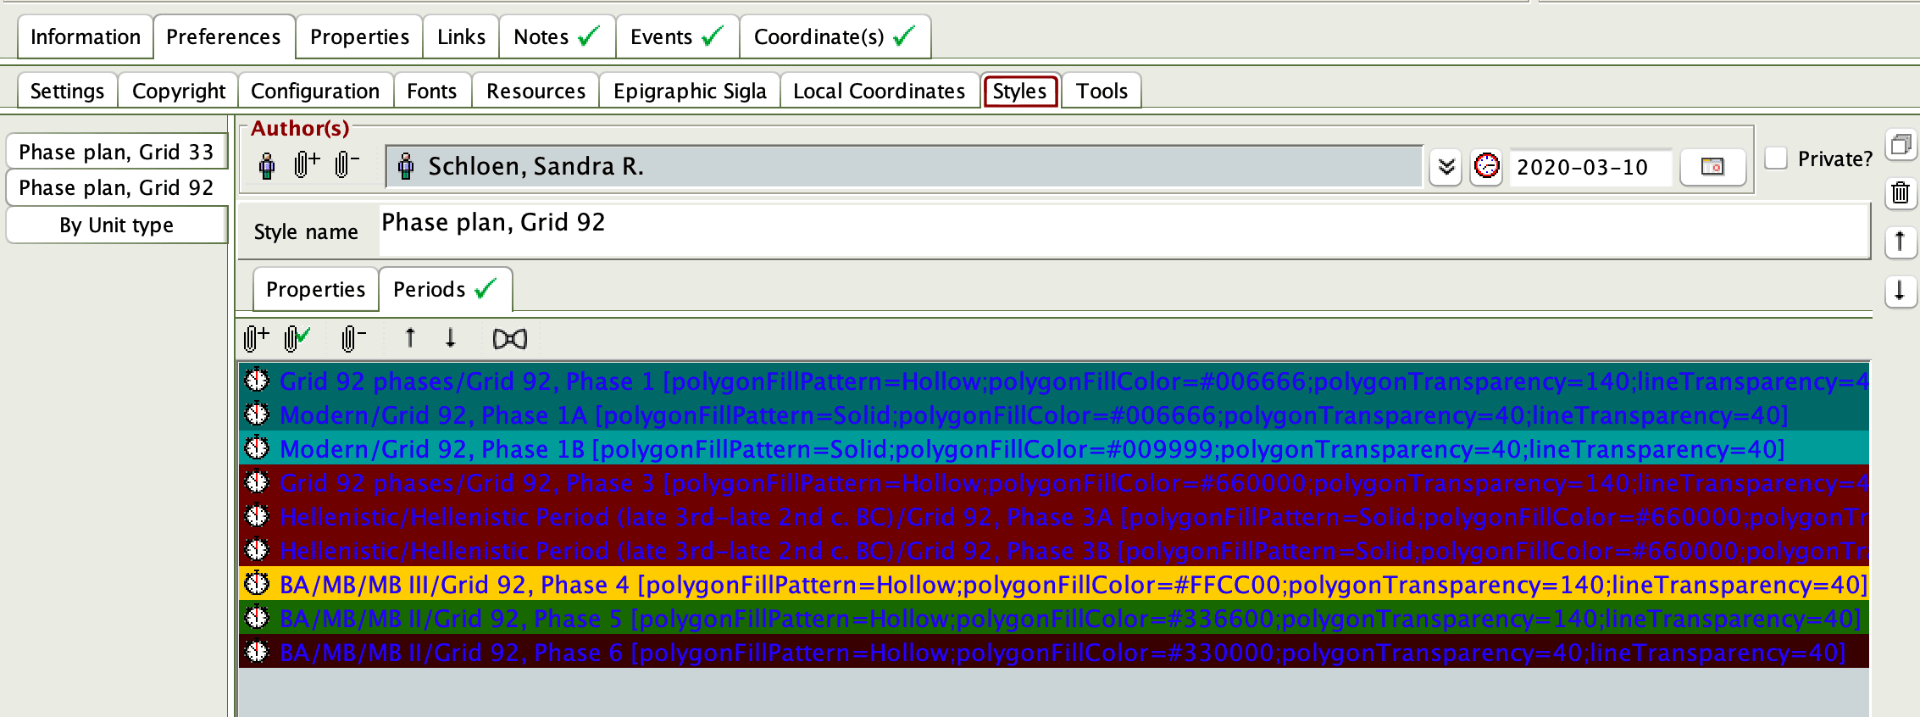
Defining Styles for use by a Harris Matrix
Once the sub-styles have been defined for each phase, select this style in the drop-down pick-list “Specify style for phases” in the Phases tab while defining the specifications of the Harris matrix.
Harris Matrix with styled Phases