Women Communicate Better – Yelp

The Company

Yelp! is a platform for user-published reviewers of local businesses. Yelp!’s human users submit feedback to the website on local businesses with two types of information: a 5-star rating and textual reviews.  


The Profile

Yelp! is an active user of prize competitions to better understand and use of the human-inputted data and crowdsource novel approaches to improve its service for users.  The company is currently promoting the 9th iteration of its dataset challenge, with a total of ten prizes amounting to a modest $5,000.

The subset of data includes 11 cities spanning 4 countries (Germany, UK, US, Canada), which means that users have access to over 4M reviews for ~150K businesses for analysis.  For the ninth iteration, Yelp! Is also including 200K user-uploaded photos in the dataset for analysis.

Contrary to the Netflix competition, Yelp! leaves the challenge question and the success metric open-ended to applicants to explore what interests them in the dataset; judging the submissions on technical rigor, the relevance of the results and novelty.  


Previous Winners:

One interesting proposal from a winner in the first dataset challenge at University of California-Berkeley used Natural Language Processing (NLP) to extract various subtopics of the individual’s text review. The team used unsupervised machine learning to classify the categories of subtopics that diners mentioned in text reviews; they included areas of interest such as, restaurant service, decor, food quality.  With the subcategories developed by the machine algorithm, the team then could predict for a given review what each subtopic’s rating would be.  

This form of machine learning and natural language processing is helpful to (1) evaluate the accuracy of the star rating given by a user and (2) help small business owners improve their service.  The subtopics approach attempts to not overweight one aspect of a user’s experience into the overall score.


Potential for Improvement

  1. Yelp! could improve the value of this subtopic analysis with human input.  By enabling users to assign tags (“ambiance”, “decor”) to a review or, or even better, a 5-star score for each subtopic (as TripAdvisor currently does), Yelp! could enrich its dataset for users and small businesses.  NLP could help suggest tags to users (as with Stack Overflow) from the textual analysis of the provided review or users could input their own.  
  2. One could see this area of subtopics moving in a different direction, as currently, Yelp! reviews are conglomerated for one business that provides multiple services (i.e. a hotel that has a spa and restaurant).  Similarly, Yelp! reviews for a restaurant that serves brunch and dinner are combined into a single ratings score.  This prohibits users from understanding the value the business provides to them for one particular service.    By using NLP and human input on subtopics (e.g. tagging “spa”, “facial”, “brunch”), the user could have a more granular view of the quality of business offering for what the user is trying to achieve. The user could then assess the value of the business based on the service most relevant to their needs, rather than the business as an undifferentiated whole.

https://engineeringblog.yelp.com/2017/01/dataset-round-7-winners-and-announcing-round-9.html

https://www.yelp.com/dataset_challenge

https://www.yelp.com/html/pdf/YelpDatasetChallengeWinner_ImprovingRestaurants.pdf

https://www.ischool.berkeley.edu/news/2013/students-data-analysis-uncovers-hidden-trends-yelp-reviews
Arity – Using Data Analytics to Make Roads Safer

Opportunity

Until recently, the automotive insurance industry used archaic methods to assess driver risk. Driver premiums were based on factors such as geography, age of the driver, whether or not the driver had been in an accident before and the type of car they drive. However, these factors are not good indicators of risk and heavily depend on an event taking place such as an accident. Any accident, leads to a huge cost and payout for an insurance company. The question the industry started to ask was, is there a way to predict risk before the fact and prevent accidents from happening at all?

This led to the advent of Usage Based Insurance. The premise is simple, using sensors to detect driving patterns which indicate risky behavior before a costly event takes place. This helped insurance providers identify risky drivers and charge more accurately based on driver’s risk profiles. The same technology can be used to provide feedback to driver, helping them improve their driving habits, in effect reducing the risk of an accident.

Solution


Allstate OBDII Device

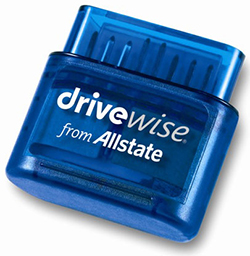
Arity recently spun out of Allstate, bringing machine learning and predictive analytics to better predict risk and help drivers understand their driving behavior. The solution initially started with the use of a OBDII based dongle, which once inserted into a car’s diagnostic port, would capture driving information from the vehicle (speed, diagnostics, accelerometer, GPS). Using proprietary models and machine learning, the data from the OBDII device is used to give each driver a risk score. This score determines the drivers likelihood to get into an accident and finally their viability as a customer. In most cases, the insurance company elect to not insure a high risk driver and most good drivers would actually see their premiums decrease.

While the solution using a dongle worked well, it was not cost effective and neither could it be used to gather information about the driver’s behavior. The next stage of this technology has moved to using the driver’s mobile device as a sensor. A driver’s mobile device being used to collect information such as

  • travel speed,
  • Acceleration,
  • Deceleration,
  • cornering speeds,
  • time of day,
  • Usage of the phone (connected over a Bluetooth device, or was the phone physically in the drivers hand)

All of this information is processed through proprietary models and compared to risk data. Arity has access to 21 billion miles and over 85 years of Allstate’s insurance underwriting data which is the baseline to creating accurate risk models. This allows Arity to create a driver risk profile and also provide feedback to the driver directly through the app on their mobile device. 

Effectiveness and Commercial Promise

According to the National Safety Council, cell phone use while driving leads to 1.6 million crashes each year. 1 out of every 4 car accidents in the United States is caused by texting and driving. The estimated economic cost and comprehensive cost caused by phone usage while driving are $61.5 and $209 billion. Arity’s solution monitors a driver’s interaction with a mobile device along with driving behavior, which would deter or notify the consumer when they are distracted.

Insurance companies can leverage this technology to identify risky drivers and help them improve their driving habits. For example, Allstate’s Drivewise application allows policyholders to save up to 3% of their insurance cost when using the app to manage their insurance. After the first 50 trips, the auto insurance holders may earn up to 15% cash back based on their driving behaviors and risk profile. Arity’s solution is particularly important to the highest risk group: teenage and student drivers and can help them be safer on the road.

Ride sharing and commercial fleet customers –Taxi, Bus, Uber and Lyft are also looking for was to better track the performance of their employees and drivers. These companies would be able to manage risk better through the platform. They can qualify drivers based on driving behaviors and retain the safe drivers. High risk drivers also negatively hurt the riding experience of customers and ultimately hurt their brands. By using Arity’s platform, the companies can weed out high risk drivers and thereby lowering their auto insurance cost.

Alterations

Today the algorithms do not take into account external factors. Our recommendation is to include:

  • weather information,
  • Location – proximity of known bars or high risk areas
  • Improve data from mobile phones as the data is not very clean
  • Make use of wearables as additional sensors which can provide insights into driver health information
  • Lastly, partner with OEMs to get access to connected car data which is much more reliable than the data from mobile devices for tracking vehicle movement

Competitors

Given multiple potential applications there is a space in the industry for many companies to operate successfully. Arity is positioned to outperform its competitors today due to the amount of data they can collect through Allstate’s large and diverse customer base. Arity is also making its platform available to other smaller insurance companies and fleet operators which will enable Arity to collect larger amounts of data which in turn will help improve the risk models.

Octo America

  • Primarily partners with government
  • A global firm without strong data and market penetration in US

Cambridge Telematics

  • Primary works with StateFarm insurance
  • The data used for modelling is not as diverse as Arity

Zendrive

  • Primarily targets the B2C segment but monetizes through B2B
  • No current partnership with insurance company


Research Links

https://developer.arity.com/driving-engine-sdk

https://www.zendrive.com/how-it-works/

http://www.naic.org/cipr_topics/topic_usage_based_insurance.htm

https://www.arity.com/index.html

https://www.octousa.com

https://www.cmtelematics.com/

https://crashstats.nhtsa.dot.gov/Api/Public/ViewPublication/812348

https://www.edgarsnyder.com/car-accident/cause-of-accident/cell-phone/cell-phone-statistics.html

https://www.edgarsnyder.com/car-accident/cause-of-accident/cell-phone/cell-phone-statistics.html

https://crashstats.nhtsa.dot.gov/Api/Public/ViewPublication/812348


Team – March and the Machines

Ewelina Thompson, Akkaravuth Kopsombut, Andrew Kerosky, Ashwin Avasarala, Dhruv Chadha, Keenan Johnston

SDR.ai – CJEMS Pitch

The Problem / Opportunity

Sales Development Representatives (SDRs) help companies find and qualify sales leads to generate a sales pipeline for the Account Executives, who then spend their time working with the customer to close a deal. The SDRs are a vital part of the sales process, as they need to weed out people that will not buy to find the ones that likely will, but their work is often repetitive and cyclical. SDRs work with large data sets and follow a clearly defined process, making them ideal candidates to integrate aspects of their jobs with automation. While it is still on the human SDR to understand the pain points of the prospective customer, an opportunity exists to better personalize messaging and make use of the available data to increase the final close rates for sales teams.

Current SDR emails already utilize templates, but they do not take into account what works and what doesn’t, and while it is possible to analyzing open / click rates of emails, linking this to revenue, or even spending time tweaking emails to add extra personalization, detracts from the time SDRs could spend on the phone with customers.

The Solution

SDR.ai aims to solve this problem by creating emails that mimic what actual SDRs sound like, without the template, taking into account the available data on what works vs. what doesn’t. It will integrate with existing popular CRMs, like Salesforce, to learn from previous email exchanges and aggregate data in one place. Messages can be personalized to the recipient in order to create a more authentic message. Additionally, and most importantly, SDR.ai can send so many more messages, increasing the volume of potential leads and the chances of bringing in additional revenue.

After initial training and manual emails, SDR.ai will continue to build smart responses, with the goal of handling everything up except phone calls, including scheduling and even finding the right person for SDRs to email from a prospective company (by using integrations like LinkedIn and Rapportive). Unlike real employees, SDR.ai is online 24/7, thus making it easier to connect with clients abroad, who normally have to take time differences into account, losing valuable time and creating even longer sales cycles.

Pilot & Prototype

To ensure that we are creating a product customers actually want to use, we plan to pilot SDR.ai after an MVP is created in order to gauge early feedback. On average, compensation for an SDR is high, with a base of $46k and an OTE variable comp of around $72k. We can convince companies to be part of our pilot program by showing how we ultimately can either reduce the need for so many SDRs or bring in additional revenue per SDR.

Data Collection

To ensure we collect enough data to make the prototype of the product useful and accurate, we plan to partner with software (SaaS) companies that handle a large volume of leads. Given that this product can be tied directly to revenue generation, companies will likely be willing to try the prototype. From here, we could collect data on the most common language used, tied to deals that have been closed historically. By integrating with popular CRMs like Salesforce that already store historical data and emails used, we can determine how many emails on average it takes before deals are progressed from the SDR to the Account Executive. We also can take things a step further by looking at what is useful across different industry verticals, as CRMs already store this type of information.

Validation

After the pilot runs its course for a month or so (or whatever the average sales cycle length is), we can review the validation of the emails that were created with SDR.ai compared to those that were not. In short, we can validate that emails were (a) more readily responded to by either picking the right person in the organization (i.e. less emails that pass SDRs from one employee in a prospect client to another) and / or due to shortened response times or (b) opened and responded to by analyzing the language used in each response. The language can be continually refined and tweaked based on #2 until SDR.ai finds the right optimization of length, follow up, and personalization.

Team Members

Marjorie Chelius

Cristina Costa

Emma Nagel

Sean Neil

Jay Sathe

Sources

http://blog.persistiq.com/the-rise-of-sales-development?

https://www.salesforce.com/blog/2014/08/what-is-sales-development-gp.html

https://www.saleshacker.com/day-life-sales-development-rep/

https://resources.datanyze.com/blog/preparing-for-future-without-sdrs


Pokemon Go: Augmented Reality

The problem:

Virtual reality, for all its advocates has one clearly apparent shortcoming: the absence of integration with daily human behavior. A virtual world is one separate from the one we physically live in. Augmented Reality, on the other hand, uses technology to connect us with real world experiences. A prime example of this is Pokemon Go, which launched the first successful AR-based gaming app in 2016. In this post, we will examine Pokemon Go as a success case for integrating AR into our entertainment seamlessly.

Solution:

Pokemon Go is a game in which characters are overlaid on the real built environment throughout the world, featured in areas of note or importance. The primary purpose of the game is to obtain a list of different pokemon monsters, all of which are located in different places. Along the way you have to recharge, and hunt for monsters that rank in rarity or availability and location.

The game overlays a virtual interface to the real world map on your cellphone and can sense your habits and project different goals and objectives depending on the user.

Effectiveness

The game is highly dependent on user network effects to determine which characters appear in different locations. It does this by running algorithms on desired  or “rare” characters and then featuring them for brief moments in uncommon locations. The users then communicate with each other through the platform to share news of each rare sighting to and eventually congregate in the same area.

Using AR, the game has enabled users to connect to a virtual reality world and incentivises activity which has then been used to relate back to the real world. A clear example of this would be businesses that pay a fee to be listed as a “pokestop” where game players can recharge their lives, and in doing so patronise the store. This has taken marketing to a whole different level and created a separate platform for businesses to target the user demographic that play the game.

The game has also been able to simultaneously overlay reality with virtual reality without the use of any special hardware (like a VR headset or console). In doing so, an artificial environment has been created on the users mobile phone, surpassing the multiple levels of stimulus that you would receive from the real world image presented. This offers the ability for this sort of AR platform to engage users through a myriad outreach mechanisms extremely effectively.

The Future of AR

Pokemon Go is an example of how effective blending the physical and virtual worlds can be in a user experience. This was the first time AR was brought to a mass audience. The rapid adoption and wild success of the game shows that AR is very much technology that’s here to stay, and can be implemented on existing platforms without too much effort. This opens the door to multiple future uses, beyond chasing a yellow cartoon character around town.

References

https://www.nytimes.com/2016/07/12/technology/pokemon-go-brings-augmented-reality-to-a-mass-audience.html?_r=0

https://www.theguardian.com/technology/2016/oct/23/augmented-reality-development-future-smartphone

https://www.recode.net/2016/9/19/12965508/pokemon-go-john-hanke-augmented-virtual-reality-ar-recode-decode-podcast

http://kwhs.wharton.upenn.edu/2016/08/pokemon-go-technology-behind-merging-digital-physical-world/

Team Awesome

Cash Class

The Problem

American education is an expensive endeavor. It is one of the highest categories of government spending, but the system is still struggling to yield strong academic outcomes for all children across socioeconomic class and race. In 2002 federal discretionary funding for education was at $49 million and in 2016 it was at $68 million. There has been a 40% increase in education funding, but yet not a 40% increase in educational improvements. Clearly spending more money does not yield better educational outcomes in the US. This can be seen most dramatically in the case where Mark Zuckerberg donated $100 million to Newark Public Schools in an effort to transform Newark schools in five years; five years later all the money was spent and Newark schools were still an absolute mess. So where is all the money going?

There is little data analysis conducted on where the government directs funds, how schools spend money, and how this spending does or doesn’t correlate with student performance. Current school funding evaluation is at a very high level based on grants or per pupil spending and then very granular with school budgets and audits. There needs to be effective analysis and tracking of the middle spending in public schools from the local to federal level.


The Solution

To foster effective spending in public K-12 education that yields academic results for our kids we bring you Cash Class. At the school, district, state, and even federal levels Cash Class will track and analyze spending to discover causational relationships between financial allocation and students achievement to learn what spending patterns tend to be successful. Cash Class will analyze major data sets and intake new data of participants to build personal recommendations of how budgets should be allocated given funding available and the goals of the educational entity. The services of Cash Class would be valuable to help a single principal better allocate their budget or a federal grant office decide where competitive funding is most needed to actually improve academic outcomes.  

There will be two levels of membership in Cash Class. A basic level membership will provide access to insightful trends at the national and state level associated compared with  standardized test performance. The premium membership will provide specialized contracts to pursue personal academic and financial goals of the educational entity.


The Design

So how does Cash Class work? Our product would combine internal and external sensors with machine and human algorithms to look at historical financial and academic data, in the effort to find causational relationships between specific budget allocations and academic mobility. As the the machine algorithms find and learn patterns, humans can help add specific context to the locality of a certain school or the directives associated with certain government funding. With this level of analysis the machine can identify key spending patterns in coordination with academic performance to make strategic recommendations for future spending. The more data the school or government entity can provide the better the machine algorithms will learn and the better the recommendations will become.

In order to achieve this we would utilize machine learning to flag spending and student achievement trends across all publicly available data (and private data as available), and use human feedback to confirm the plausibility of correlation. This machine and human data interpretation would be synthesized to generate major budget recommendations along with everyday spending guidance based on the client and their achievement goals. Cash Class could recommend that a school allocate $750 K to staffing and also that spending money on an online reading program may help elementary boys of low socioeconomic status accelerate their reading growth. As time progresses more spending and academic data will be added to system to help machines and humans improve budget recommendations to make better financial and educational choices for the future of America’s children.


The Competitive Advantage

There are currently accounting systems that help schools manage everyday cash flow and end of year financial accounting, but nothing that analyzes historical data to help build predictive budget models. Cash Class would be an entirely new level of money management for American education.

Group: Women Communicate Better Than Men

Ngozika Uzoma, David Cramer, Kellie Braam, Chantelle Pires, Emily Shaw

Sources 

http://www.businessinsider.com/mark-zuckerbergs-failed-100-million-donation-to-newark-public-schools-2015-9https://www.theatlantic.com/education/archive/2015/01/where-school-dollars-go-to-waste/384949/https://www.washingtonpost.com/opinions/how-newark-schools-partially-squandered-a-great-prize/2015/10/20/ffff660c-7743-11e5-a958-d889faf561dc_story.html?utm_term=.952d649e0801https://www.usnews.com/news/blogs/data-mine/2016/01/14/federal-education-funding-where-does-the-money-gohttp://www.npr.org/sections/ed/2016/04/25/468157856/can-more-money-fix-americas-schoolshttps://www.gatesnotes.com/Books/Where-Do-School-Funds-Go-Book-Review

Did DataVisor Create the Solution to Fighting Fraud?

How Costly is Fraudulent Activity?

According to the Association of Certified Fraud Examiners, businesses lose over $3.5 trillion each year to fraud. As the individuals committing fraud are becoming increasingly more sophisticated and the number of fraudulent cases are increasing, there is a huge emphasis for businesses to become better at managing this activity. To become better at managing fraud, business must prevent and identify more fraudulent transactions than current methods allow for.

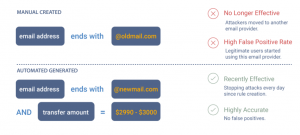
Currently, many businesses use manual rules for fraud detection and predictive prevention models. As new patterns of fraud occur, practitioners must manually update rules to manage new threats. Based on the magnitude of activity and the frequency at which fraudsters adapt to existing rules, utilizing manual rules to control fraudulent activity is arguably no longer an effective method.  

Where can business turn for help?

DataVisor’s patent-pending Automated Rules Engine solves this problem. Ultimately, DataVisor created a rules engine that adapts to changing fraud patterns. This technology automatically creates new rules to identify and prevent fraudulent activity and manages existing rules, which helps with reducing false positives resulting from outdated rules.


How does the Automated Rules Engine work?

The Automated Rules Engine utilizes big data  and unsupervised machine learning to automatically generate rules to detect and prevent fraudulent activity. Rules engines are part of many companies’ existing online fraud detection and anti-money laundering infrastructure and this technology helps banks and digital service providers recognize fraudulent activities in a more effective way.

While traditional rules engines are reactive to new attacks, unsupervised machine learning catches evolving attacks by correlating user and event attributes, automatically enabling the system to prevent attacks of this nature. Since the rules within the Automated Rules Engine are automatically being updated and refined, an added benefit of this technology is a significant reduction in employee manual review time. With employee time freed up, this enables cyber-risk teams to perform more value-added tasks that further reduce fraud risk.

Does DataVisor have a sustainable competitive advantage?

There are many competitors operating within the cyber fraud risk space. Currently, DataVisor only has a patent-pending right, which isn’t a guaranteed advantage in the marketplace. Two companies, Feedzai and Sift Science, both private entities, offer competing software that utilizes machine learning to detect and prevent fraud. Given the large market- $3.5 trillion annual revenue potential and these products effectiveness when compared to the traditional approach, there appears to be space in the market for many companies to operate successfully.


“Feedzai’s machine learning software recognizes what’s happening in the real world, how it’s different from what happened earlier, and adjust its responses accordingly. Machine Learning models can detect very subtle anomalies and very subtle signs of fraud without requiring new code or new configurations.”
“Every day, businesses worldwide rely on Sift Science to automate fraud prevention, slash costs, and grow revenue. Our cloud-based machine learning platform is powered by 16,000+ fraud signals updated in real-time from activity across our global network of 6,000+ websites and apps (and growing).”


Is DataVisor’s Automated Rules Engine a good solution?

Although DataVisor is a private company and doesn’t release financial information, on the company’s website, it shows that the Automated Rules Engine is utilized by popular companies such as Yelp, Pinterest, and Alibaba Group. Based on these successful companies’ utilization of the DataVisor product despite having access to competing products, we can assume that the product has some value within the marketplace.

As the machine learning technology relies on pattern recognition to identify fraudulent activity, it is dependent on fraudsters repeat use of historical actions. With sophisticated fraudsters constantly coming up with innovative ways to commit fraud, the machine learning tool, although more effective than manual rules, does not provide the ultimate solution.

Despite this shortfall, since fraud continues to be an expensive threat, companies will likely pay for the best option on the market to counteract this threat. Given the product attributes and an examination of competing products, we believe DataVisor’s Automated Rules Engine has a high likelihood of future commercial success.

To increase this likelihood, DataVisor should use machine learning to review actual fraud situations that were not predicted by technology and automatically create rules. An additional feature that stops users committing “abnormal” activities would also be beneficial.

Work Cited

https://www.datavisor.com/

http://www.statsoft.com/Textbook/Fraud-Detection

https://venturebeat.com/2017/02/18/how-ai-is-helping-detect-fraud-and-fight-criminals/

http://www.fico.com/en/blogs/analytics-optimization/ai-meets-aml-how-smart-analytics-fight-money-laundering/

http://www.cityam.com/241662/fraud-with-problems-ravelin-boss-martin-sweeney-talks-hailo-fake-credit-cards-and-machine-learning

http://www.pymnts.com/news/security-and-risk/2017/hacker-tracker-datavisor-global-insight-into-online-fraud-big-data-account-takeover-ato-cyberattack-aging-accounts-wonga-data-breach/

http://www.thepaypers.com/default/datavisor-rolls-out-automated-rule-engine-to-support-aml-teams/768504-0


Smart Store: Track your store like you would track the vitals of a patient in surgery

You think the shopper is smart?

With the rise in consumer preferences towards natural, organic and non-GMO food, retailers are faced with the challenge of supplying fruits, vegetables, and protein with a shorter shelf life, and adjusting to these trends of a dynamic marketplace.  86% of shoppers are confident the food they buy is safe from germs and toxins, down from 91% in 2014.  Retailers must become more operationally efficient or increase their stock to overcompensate for higher rates of spoilage in order to counteract shorter shelf life challenges.  Planning for fresh produce is more complicated than for non-perishable goods. According to a BlueYonder study, 68% of shoppers feel disappointed with the freshness of their purchases, and 14% of shoppers seek organic certification.

By using machine learning solutions, retailers will be able to optimize the environmental conditions affecting spoilage. In addition, there are risks of being out of compliance on food, health and environmental safety regulations with very high penalty, like Walmart paid $81M in environmental compliance.

How can you keep up?

Grocery retailers generally have low profit margins, so slight improvements to efficiency are important.  Our machine learning solution is aimed at helping retailers improve their management of shorter shelf life products, and ultimately their profitability through optimization of their energy cost and prediction of temperature control equipment failure.  

  • Energy Savings:  In some cases, utilities can amount to up to 50% of profit margin for a store, and energy savings driven by machine learning translate immediately to profit margins.  For example, within the perishable seafood or meat sections, overcooling is a significant cost that can automatically be optimized by sensors that measure temperature in a cooler or refrigerator.
  • Effectivity and Efficiency:  Better allocation of resources like people and machines is very useful for top and bottom line. E.g. out of stock inventory can lead to $24M lost sales per $1B retail sales. Automatic tracking of inventory levels can help increase productivity and also revenues.
  • Predictive Maintenance:  Because refrigeration equipment has to run 24 / 7, there are high breakdown rates of equipment.  Sensing equipment can be applied to HVAC and Nitrogen equipment to predict failure ahead of time.  Even just small freeze / thaw cycles can quickly damage product and lead to waste for retailers.
  • Compliance: FSMA and EPA includes multiple guidelines for retailers and grocery stores to follow, with high penalties for out of compliance.
  • Consumer behavior: Consumer preferences and potential trends can be identified and acted upon if predicted. The Amazon store could even track which products you are interested in, but  had not purchased.
  • Risk mitigation: We could observe financial transactions, customer behavior etc. to predict risks, fraud, shoplifting etc. automatically and proactively.

Organizations are already moving to smarter technology for help.


What if the store was also smart?

Grocery retailers could use advanced analytics through IOT and other technology to revamp the way they monitor their stores.

  1. Video feeds
  2. Point Of Sale sensors
  3. Mobile phones / equipment of Associates in store
  4. IR Motion Sensors
  5. HVAC and Energy monitoring using sensing of temperature, pressure, humidity, Carbon Monoxide
  6. Weight Mats
  7. Parking Space sensor
  8. Digital Signage
  9. Gesture Recognition/ accelerometers
  10. Door Hinge Sensor motion/ pressure
  11. Wifi Router and connections
  12. Shelf Weight
  13. Air Filter/humidity
  14. Lighting
  15. Electricity, Water, gas meters
  16. Spark (Temperature) for places this device is taken to

Example use cases:

  1. Predictive Device Maintenance to avoid compliance lapse (e.g. Fridge for Food Safety, Fire Safety equipment, lighting, etc.)
  2. Hazard detection and prevention through monitoring of toxic substance spill and disposal (air filter, shelf weight and video sensor)
  3. FSMA compliance across labels, food expiry, storage conditions, etc.
  4. Health safety with store conditions like canopy use, weather, leaks etc.
  5. Temperature, defrost and humidity monitoring for Ice-cream, meat, dairy, and pharmaceuticals
  6. Video analysis to predict long lines and avoid bad customer experience or lack of lost customers increased productivity etc. by alerting and optimizing resource allocation
  7. Video + Point Of Sale analysis for fraudulent transactions avoidance

A central monitoring within stores, and centrally can be created, to mimic the NASA base in Houston, is always able to support all adventurers within the store. Roger that?

_____________________________________________________________

Team – March and the Machines

Ewelina Thompson, Akkaravuth Kopsombut, Andrew Kerosky, Ashwin Avasarala, Dhruv Chadha, Keenan Johnston

_____________________________________________________________

Sources:
  1.  FMI U.S. Shopper Trends, 2016. Safe: A32. Fit health: A12. Sustain health: A9, A12. Community: A12, * The Hartman Group. “Transparency”, 2015.
  2. http://www.cnsnews.com/news/article/wal-mart-pay-81-million-settlement-what-epa-calls-environmental-crimes
  3. https://www.slideshare.net/vinhfc/out-of-stock-cost-presentation
  4. https://www.fda.gov/food/guidanceregulation/fsma/
  5. https://www.epa.gov/hwgenerators/hazardous-waste-management-and-retail-sector
  6. Amazon store – https://www.youtube.com/watch?v=NrmMk1Myrxc
  7. https://foodsafetytech.com/tag/documentation/


Team Dheeraj: Company Pitch: Check Yourself


Opportunity:

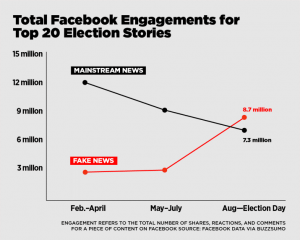
Fake news is not a new phenomenon by any means. However, in the last 12 months, the engagement of users across fake news websites has increased significantly. In fact, in the final 3 months of the 2016 election season, the top 20 fake news articles had more interactions (shares, reactions, comments) than the top 20 real articles.1 Furthermore, 62% of Americans get their news via social media, while 44% use Facebook, the top distributor of fake news.2 This represents a major shift in the way individuals receive information. With the dissemination of inaccurate content, people are led to believe misleading and often completely inaccurate claims. This will lead people to make incorrect decisions and embodies a serious threat to our democracy and integrity.

Media corporations are recovering from playing a part in either disseminating this news or inadvertently standing by. Governments have ordered certain social media sites to remove fake news or else face a hefty punishment (e.g. $50 million by Germany).3 Companies like Google and Facebook are scrambling to find a solution.

Solution:

Check Yourself (CY) provides real-time fact checking solutions to minimize the acceptance of fake news. It combines natural language processing techniques with machine learning techniques to immediately flag fake content.

The first approach will be to identify whether the article is fake based on semantic analysis. Specifically, it will connect the headline with the body of the text, see if they are related/unrelated, and then see if the content supports the headline. Verification would happen against established websites, fact trackers, and other attributes (e.g. domain name, Alexa web rank).

The second approach involves identifying website tracker usage (ads, cookies, widgets) and patterns over time and language, connecting them with platform engagement (Facebook, Twitter), and linking them with each other. This will result in a neural network where the algorithm is able to predict the probability that the source is fake.

Using an ensemble approach, combining ‘front-end’ and ‘back-end’ methods, leads to a novel solution. After designing the baseline algorithm in-house, we will then use crowdsourcing to improve upon the algorithm. Given the limited supply of data scientists in-house, it would be best to generate ideas from all disciplines, maximizing our success potential.

Pilot:

We will publicly pilot test our application through a live primary debate after we have done rigorous internal checks. As the candidates speak, information they say that is false (e.g. “The economy grew by 6% in the last year”) will be relayed to the interviewer. Additionally, the false information will also be displayed on the TV for consumers to see. At the end of the show, a bi-partisan expert panel along with fact checkers will verify whether the algorithm was accurate. Assuming a successful experiment, this has the power to allow interviewers to fact-check any claims on the spot, ensuring their viewership is well informed.

The Competition:

Currently, many companies trying to solve this problem. Existing solutions encompass mainly fact checkers, but they are not as comprehensive in their approach as we are. Furthermore, these solutions are not real-time. Universities are also trying to solve this problem but are doing so with small teams of students and faculties. The advantage we have over universities as well as companies like Google and Facebook is that crowdsourcing the solution allows for the best ideas in a newly emerging area.

Market Viability:

Even though our value proposition affects companies and customers, we will primarily start with B2B in order to build credibility and then expand to B2C. Large media companies have around 10-20 fact checkers on staff for any live debate or otherwise. This results in an average value of $600-$1.2M (assuming they spend $60k per checker per year). Furthermore, they often use Twitter and Reddit and would find our service invaluable to confirm the veracity of statements/claims immediately. Once we are established, we will move towards a B2C freemium model.

Sources:

1https://www.buzzfeed.com/craigsilverman/viral-fake-election-news-outperformed-real-news-on-facebook?utm_term=.nbR6OEK6E#.ghz5aZk5Z

2https://techcrunch.com/2016/05/26/most-people-get-their-news-from-social-media-says-report/

3https://yourstory.com/2017/04/faceboo-google-fake-news/

Stuck with 2Y’s: Latch (Pitch)

Ask: $ 200,000 ($ 100,000 – initial cloud data storage, 60,000 – team member salaries, 40,000 – marketing & advertisement and other)

Opportunity

According to Pew Research poll, 40% of Americans use online dating(1) and 59% “think online dating can be a good way to meet people”(2). UK country manager of a dating app, eHarmony, Romain Bertrand mentioned that by 2040, 70% of couples will get to meet online(3). Thus, the online dating scene is a huge and ever growing market. Nevertheless, as of 2015, 50% of the US population consisted of single adults, only 20% of current committed relationships have started online, and only 5% when it comes to marriages(1). There is a clear opportunity to improve the success rate of dating apps and improve the dating scene in the US (for a start).

As per Eli Finkel from Northwestern University (2012) (3), likelihood of a successful long-term relationship depends on the following three components: individual characteristics (such as hobbies, tastes, interests etc.), quality of interaction during first encounters, and finally, all other surrounding circumstances (such as ethnicity, social status etc.). As we cannot affect the latter, dating apps have been historically focusing on the first, and have recently started working with the second factor, by suggesting perfect location for the first date etc.

For individual characteristics, majority of dating apps and websites focus on user-generated information (through behavioral surveys) as well as user’s social network information (likes, interests etc.) in order to provide dating matches.  Some websites, such as Tinder, eHarmony and OkCupid go as far as to analyze people’s behavior, based on their performance on the website and try to match the users to people with similar or matching behavior.

Nevertheless, current dating algorithms do not take into account vital pieces of information that are captured neither by our behavior on social media, nor by our survey answers.

Solution

Our solution is an application called “Latch” that would add the data collected through wearable technology (activity trackers such as Fitbit), online/offline calendars, Netflix/HBO watching history (and goodreads reviews), and user’s shopping patterns via bank accounts to the data currently used in apps (user-generated and social media) in order to significantly improve offered matches.

According to John M. Grohol, Psy.D. from PsychCentral, the following are the six individual characteristics that play a key role in compatibility of people for a smooth long-term relationship (4):

  • Timeliness & Punctuality (observable via calendars)
  • Cleanliness & Orderliness (partially observable – e-mails/calendars)
  • Money & Spending (observable via bank accounts)
  • Sex & Intimacy
  • Life Priorities & Tempo (observable via calendars and wearables)
  • Spirituality & Religion (partially observable via calendar, social media, Netflix/HBO patterns, and e-mail)

Out of the six factors mentioned above, 5 are fully or partially observable and analyzable through the data already available online or offline via the sensors mentioned earlier. As all the information we would request digs deeper into privacy circle of a target user, we would be careful to request only information that adds value to our matching algorithm and will use third-parties to analyze such sensitive info as spending patterns.

Commercial Viability – Data Collection

As a new company entering the market Latch would have a clear advantage over the current incumbents, as it would not have to use old and commonly used interface of dating process. As per Mike Maxim, Chief Technology Officer at OkCupid, “The users have an expectation of how the site is going to work, so you can’t make big changes all the time.”

Prior to the launch, we would have to collect initial information. In order to analyze only the relevant data we would have to analyze the behavioral patterns of current couples before they started dating. Thus, we would aggregate data available on their historical purchase decisions and time allocation in order to launch a pilot.

Pilot

The pilot version will be launched for early adopters based on human- and machine-analyzed historical data of existing couples. The early adopters would use automated sensors (Fitbit, gmail etc.) to aggregate data on their spending and behavioral patterns, which will be compared by Latch to algorithms developed on previous experience of existing couples, and will generate matches. Further, the future success rate and compatibility of the matched early adopters will be fed back into the data, and used for further pattern recognition and improved matching algorithms with next users. Future expansion opportunities exist by integrating DNA ancestry analysis (such as provided by MyHeritage DNA), digging deeper in geolocation data (suggest which coffee shops both matches visited), matching games/apps usage history on smartphones, and other.

Sources:


Alexander Aksakov

Roman Cherepakha

Nargiz Sadigzade

Yegor Samusenko

Manuk Shirinyan

Bright Cellars: Simplifying Wine Through Algorithms

The Problem / Opportunity

Entering the world of wine can be very daunting, there are seemingly endless varietals/regions and even more vineyards to explore. For someone with little exposure to wine who is looking to learn more about the topic some of the only ways to find out what types you like is the guess-and-check method. For many people, this is extremely frustrating and can be a large waste of money.

Many subscription services offer to filter through the landscape by sending 6 or 12 bottles a month to a person. Unfortunately, this method offers little to no customization to a person’s taste or preferences as the services generally send the same bottles to all their members. Currently, there are few services that offer a quick, affordable, and curated solution for people to experience wines based on their taste preferences.


The Solution


The subscription-based service, Bright Cellars looks to take out what most people find to be the boring hard part about drinking wine – picking out one that they will like! Users go to the Bright Cellars website and take a quiz that gives the company insights into your personal preferences. From there, “the algorithm scores each wine by comparing 18 attributes to your preferences” and you receive a box of wine that the algorithm has picked out for you.


Once a user has received and tasted their wine, they can rate the matches that the Bright Cellars algorithm has provided them. This iterative process allows the algorithm to better learn a user’s preferences the more a person enters ratings and uses the service. As the database of ratings keeps growing the algorithm can draw associations from what other people have liked, the creators view the service as a subscription service and Pandora-like matching service mixed into one. Bright Cellars is targeting the millennial market who have not yet committed to drinking a specific type of wine yet, don’t know what they like, or are looking to experiment with uncommon varietals.


Market & Comparable Solutions


Obviously, the wine market is very mature as is the idea of a subscription wine service with many different options available to consumers. Some of the companies that are getting similar press and attention as Bright Cellars are Club W and Pour This.


Club W started off with a very similar model as Bright Cellars, people would take a quiz and they would source and select bottles based on the quiz results. Most recently they have acquired their own winery and have rebranded to Winc. Now members are paired with wines that are made in house or that come from small partner vineyards. They still have a profiling quiz and rating algorithm that tries to continually better understand their members’ taste preferences. This is the closest competitor to Bright Cellars, but as they have their own in-house wine, the algorithm and cost structure is significantly different.


Pour This, on the other hand, acts more in the capacity of a traditional wine subscription service but proclaims that it is more curated than its predecessors. Pour This sends its members the same lot of three wines, but they are all hand picked by their in-house curator and tend to be very obscure. They are looking to capture the market of people who want to explore new and different wines that they might never have come across or experimented with in their wine consumption.


Proposed Alterations


Bright Cellars could make their offering even more customizable by allowing people take quizzes based on their wine experience or knowledge. Someone who knows exactly what they like but is looking to be exposed to more uncommon brands might want to be able to specify that initially. Currently, their model only really caters to those who are beginners in wine and can only identify flavors they prefer rather than wine producing regions or countries.


Additionally, Bright Cellars with $150,000 could hire another full-time employee to make improvements to the algorithm while the founders work on business development. This is especially true as they grow the business and look to work directly with wineries.  


Sources

https://www.brightcellars.com/


http://www.bizjournals.com/boston/blog/startups/2014/08/birchbox-for-wine-bright-cellars-wants-to-use-big.html


http://news.mit.edu/2015/alumni-wine-matching-startup-bright-cellars-0903


https://www.geekwire.com/2015/online-wine-club-uses-an-algorithm-to-find-you-the-perfect-wines/


http://www.xconomy.com/wisconsin/2015/08/18/bright-cellars-snags-1-8m-to-expand-wine-delivery-service/#


https://www.eater.com/drinks/2015/12/10/9881394/best-wine-club-delivery-online