Unbabel: Removing Language Barriers at Scale

The Problem / Opportunity

The world has become increasingly more connected through the rise of the Internet, yet there still remains the problem of effective communication given the number of languages that exist. While services like Google Translate can help people get by in everyday life, albeit poorly translated, and DuoLingo helps consumers learn and practice new languages, translation services in the business world remain difficult. As organizations become ever more globally focused, communicating both internally and with customers remains a problem. While English was the most dominant language of the Internet in the late 90s, the democratization of the Internet has led English to only represent 30% of all content. There is a need for businesses to be multilingual, yet it is extremely expensive and difficult to hire personnel that can provide these translation services.


The Solution

Unbabel uses a combination of Natural Language Processing, algorithms, and a network of 40,000+ human post-editors to enable quality translations. By integrating with services like Salesforce and Zendesk to start, Unbabel is already integrating in workflows that companies know and love. Like we have discussed in class, the real winning piece of this solution is the combination of artificial and human intelligence, as Unbabel’s technology gets smarter as its human editors correct it. The algorithm needs training to continually improve and learn the idiosyncrasies of the myriad of human languages that exist. As of now, the technology handles about 95% of the translation, while the human translators help bring the translations to a more accurate level. Having this combination allows Unbabel to offer services faster and cheaper to companies than they could receive using Google Translate and an in-house expert, not to mention a much larger content library of languages.


Market & Comparable Solutions

Google Translate has made recent breakthroughs in translation services with its Neural Machine Translation, which translates whole sentences rather than performing it piece by piece, ultimately leading to a more relevant translation as the system can use context to figure out the translation. Google Translate was able to make more strides in recent months than it had in the past 10 years, proving that this is becoming a viable competitor for Unbabel. Yet Google’s focus has largely been consumer-focused for these applications, and since the company usually has its hand in a variety of fields, we do not see it entering business translation services at this immediate time.

Skype has created Skype Translator to help translations occur in real time during video calls. Given how ubiquitous the company is, this is an obvious step for them. However, the company currently only offers voice in 8 languages, and text in 50 for messaging. Skype is also focused not on the business segment yet, and will unlikely abandon the video focus, as that is the company’s bread and butter.


Proposed Alterations

While the company is focused largely on text, given its integrations with ZenDesk and Salesforce to start, it would do well to also consider voice services, as customer success agents and salespeople alike spend most of their time on the phone. Alternatively, the company can decide to go niche on more business functions that will need to take advantage of these services or go after verticals that are largely global in focus. The company needs to think of ways to create a moat of defensibility so that large enterprises like Google and Skype do not shift gears to offer business translation services, especially since both companies are heavily invested in artificial intelligence.


Team Members

Marjorie Chelius

Cristina Costa

Emma Nagel

Sean Neil

Jay Sathe


Sources

https://unbabel.com/ & https://www.zendesk.com/apps/unbabel-translate/ & https://appexchange.salesforce.com/listingDetail?listingId=a0N3A00000EFom8UAD

http://www.businesswire.com/news/home/20161103005153/en/Unbabel-Raises-5-Million-Bring-Artificial-Intelligence

http://www.marketwired.com/press-release/unbabel-inc-raises-15m-seed-funding-from-matrix-partners-google-ventures-other-leading-1931000.htm

http://www.geektime.com/2016/02/25/portugal-startup-unbabels-ai-puts-google-translate-to-shame/

https://www.skype.com/en/features/skype-translator/

https://blog.google/products/translate/found-translation-more-accurate-fluent-sentences-google-translate/


Stuck with 2Y’s: Rewarding Safe Driving (Profile)


The Opportunity

Road safety continues to dominate as a non-natural cause of death. At the same time, car insurers continue to base their pricing decisions mainly on the history of accidents, car age, and tickets, as well as self-reported mileage. In the face of increasing average age of cars, as well as increasing repair costs, that strategy decreases insurance companies margins.

Yet before the self-driving cars populate our streets, augmented intelligence is capable of assisting the society by detecting bad and good driving behavior. Safe driving could be rewarded.

Solution

Driveway, a telematics software start-up founded in 2008, developed an application that allows measuring driving behavior1. A GPS-tracker allows to measures speed, acceleration, braking habits2, with all these data put in the location (speed limits, road quality, altitude) and time (weather, brightness) context. Additionally, the mobile application also analyzes distracted driving data such as texting (that is so proven to be a cause of many accidents). The software app analyzes each trip and provides a ranking of the driving behavior as well as suggestions on what could be improved.

There are two major uses of the data: individual car insurance pricing and selling of the insights generated from analyzing the data (such as identifying bottlenecks in the road structure, understanding the aggregated driver behavior in response to various factors, learning the patterns that lead to collisions etc.)

Effectiveness and Commercial Promise

Driveway shoots for the stars by creating a personal driver’s profile and offering insurance programs at a discount if the profile outperforms peers – a positive reinforcement. They also plan to sell aggregate driver’s behavioral information to insurance companies, so that they could offer better programs to different categories of drivers.

The company competes with the legacy insurers that offer customers to install GPS devices in their cars and provide behavior-based pricing based on tracked GPS data (23% insurers launched usage-based insurance programs, but only 8.5% customers opted in as of 20143), as well as independent telematics firms such as Root, Drivefactor, and others4.

Other parts of the ecosystems are the marketplaces where different companies can exchange their data to make all risk scoring models more robust: Verisk Telematics Data Exchange5, DriveAbility Marketplace.

Driveway uniqueness comes from its integration of the distracted driving sensors, proprietary algorithms, as well as making it cheaper and faster for customers to enroll (as no device has to be physically installed in the car). Essentially, Driveway uses smartphones as a source of sensors and transforms the data into unique insights through the proprietary algorithms.

Motor Vehicle Accidents are the leading cause of unnatural deaths. Hence, besides commercial potential, Driveway offers a great social benefit. a survey of drivers has shown that a turned on telematics device changes behavior: 56% of surveyed drivers who installed a telematics device reported changes towards safety in the way they drive3.

Unnatural causes of death:

Alterations and the untapped potential

More available data and combinations of sensors might increase the number of driving metrics. Having enough history and combining it with human-based evaluations, Driveway could evaluate how tired a driver is, whether he/she is intoxicated and/or overall just inexperienced. Furthermore, Driveway could expand a use of its software behind pricing car insurance. Potential applications could be cross-marketing, finding high-quality candidates for Uber/Lyft peak hours and routes.

It would also be useful to bundle Driveway with other products in order to minimize positive selection bias (i.e. only good drivers opting in for user-based insurance). While such bundling poses certain ethical and privacy challenges, one example that would be beneficial to both society and businesses is for people to provide their Driveway data in order to get a credit score.

The data can also be used for behavioral/social studies and offer unique insights into non-driving related fields.


Team members:

  • Alexander Aksakov
  • Roman Cherepakha
  • Nargiz Sadigzade
  • Yegor Samusenko
  • Manuk Shirinyan


Sources:

  1. http://www.driveway.ai/news/
  2. https://www.towerswatson.com/en/Services/services/telematics?gclid=CL7N-9ru4NMCFUa2wAod3eIOZg
  3. http://www.insurancejournal.com/news/national/2015/11/18/389327.htm
  4. http://aitegroup.com/report/auto-insurance-telematics-vendor-overview
  5. http://www.verisk.com/downloads/telematics/data-exchange/commercial-auto/Verisk-Data-Exchange_Data-Value.pdf


Team Dheeraj: Actually Intelligent

A Judicial COMPAS

About 52,000 legal cases were opened at the federal level in 2015, of which roughly 12,000 were completed. This case completion rate of 22% has remained virtually unchanged since 1990 and what this simple analysis shows is that the US court system is severely under-resourced and overburdened. Understanding this phenomenon explains the rise of COMPAS. Today, judges considering whether a defendant should be allowed bail have the option of turning to COMPAS, which uses machine learning to predict criminal recidivism. Before software like this was available, bail decisions were made largely at the discretion of a judge, who used his or her previous experience to determine the likelihood of recidivism. Critics of this system point out that the judiciary had systematically biased bail decisions against minorities, amplifying the need for quick, efficiency, and objective analysis.

Statistics In Legal Decision Making

Northpointe, the company that sells COMPAS, claims that their software removes the bias inherent in human decision making. Like any good data-based company, they produced a detailed report outlining the key variables in their risk model and experiments validating the results. Despite using buzzwords like machine learning in their marketing material, there’s nothing new about using statistical analysis to aid in legal decisions. As the authors of a 2015 report on the Courts and Predictive Algorithms wrote:  “[over] the past thirty years, statistical methods originally designed for use in probation and parole decisions have become more advanced and more widely adopted, not only for probation and bail decisions, but also for sentencing itself.”

Finding True North

Northpointe uses Area Under Curve (AUC) as a simple measure of predictive accuracy for COMPAS. For reference, values of roughly 0.7 and above indicate moderate to strong predictive accuracy. The table below was taken from a 2012 report by Northpointe and shows that COMPAS produces relatively accurate predictions of recidivism.  

Yet, a look at just the numbers ignores a critical part of the original need for an algorithm: to introduce an objective method for evaluating bail decisions. Propublica, an independent nonprofit that performs investigative journalism for the public good, investigated whether there were any racial biases in COMPAS. What the organization found is “that black defendants…were nearly twice as likely to be misclassified as higher risk compared to their white counterparts (45 percent vs. 23 percent).” Clearly there’s more work to be done to strike the right balance between efficiency and effectiveness.

Making Changes to COMPAS

Relying on algorithms alone can make decisions makers feel safe in the certainty of numbers. However, a combination of algorithms could help alleviate the inherent biases found in COMPAS’ reliance on a single algorithm to classify defendants by their risk of recidivism. An ensemble approach that combines multiple machine learning techniques (e.g. LASSO or random forest) could not only help address the racial bias pointed out above but could also help address any other factors that decisions could be biased on such as socioeconomic status or geography. In addition, if the courts are going to rely on algorithms to make decisions on bail, the algorithms should be transparent to the defendant. This not only allows people to fully understand how decisions are being made but also allows people to suggest improvements. This latter point is particularly important because the judiciary should have a vested interested in a fair system that is free from gaming, which could occur in the absence of transparency.

Sources:

  1. https://www.nytimes.com/aponline/2017/04/29/us/ap-us-bail-reform-texas.html
  2. https://www.nytimes.com/2017/05/01/us/politics/sent-to-prison-by-a-software-programs-secret-algorithms.html
  3. http://www.law.nyu.edu/sites/default/files/upload_documents/Angele%20Christin.pdf
  4. http://www.northpointeinc.com/files/technical_documents/FieldGuide2_081412.pdf
  5. http://www.uscourts.gov/sites/default/files/data_tables/Table2.02.pdf
  6. https://www.propublica.org/article/how-we-analyzed-the-compas-recidivism-algorithm


AI: Jail-Break -Breaking the vicious cycle of re-incarceration

Problem

Within 3 years of release, over 2/3rd of prisoners are re-incarcerated.1  States collectively spend $80 billion a year on correctional costs.2 This is a vicious cycle that must be broken for the sake of these individuals, their families and communities, and the taxpayer dollars that go to support our overcrowded prison system.

These prisoners end up incarcerated as a result of all kinds of crimes and come from all sorts of backgrounds. Studies show that 80% of federal prisoners battle with a history of drug or alcohol abuse, 2/3rds do not have a high school diploma, up to 16 percent have at least one serious mental disorder, and 10% are homeless in the months up to incarceration.3

Each offender is battling with a unique set of issues and has a unique set of goals so they need a unique treatment plan to get back on their feet. For instance, for offenders with children, parental responsibility can interfere with their requirement to attend Alcoholics Anonymous or stick to a curfew or house arrest. On the other hand, regaining custody of their kids can be a major motivating factor for sticking to the program. Those families may benefit from specialized offerings like parenting classes.4

So how do we know what is right for each prisoner?


Solution

We will construct an AI model to 1) determine which prisoners are more likely to be re-incarcerated and 2) which re-introduction programs are more effective in keeping which prisoners from being re-incarcerated. The inputs of the model will be demographic data, behavioral data and crime data of prisoners, and the re-introduction programs they received before being released. The output of the model will determine how likely that prison is to be re-incarcerated.

Once we construct the model, we can 1) identify the high-risk prisoners and deploy more resources to help them and 2) create programs that are more likely to succeed in helping a particular set of prisoners.

This solution can be used by federal or state prison systems themselves. It can also be provided by the private sector and sell to the government as a service. Given the significant economic interest at stake, if the solution is effective, the government is highly likely to pay for the solution.


Pilot

The objective is to construct, evaluate and implement a model to recommend re immersion programs to people with recent criminal history to reduce their probability of recidivism. The model will be an hybrid between a knowledge model, tell me what fits based on my needs, and a collaborative system, tell me what’s popular among my peers.

The main challenges to implement this solution are the data, as there are thousands of covariates but not so many observations (people that has been part of a program) and timeframe, a person can commit crime again at any given point of life.

In order to train the model, we will collect data from organizations that are already working with men and women that had recent criminal history. Some of this organizations are the Center for Employment Opportunities, Prison Entrepreneurship Program, and The Last Mile.

To validate the model we will run a 2 bin experiment: (i) status quo, (ii) recommended program in order to determine the real effect of our recommendation model. Hopefully, we will reduce recidivism significantly and thus improving the quality of life of people while saving cost to the government.


Team members:

Alex Sukhareva
Lijie Ding
Fernando Gutierrez
J. Adrian Sánchez
Alan Totah
Alfredo Achondo

References:

1 Durose, Matthew R., Alexia D. Cooper, and Howard N. Snyder, Recidivism of Prisoners Released in 30 States in 2005: Patterns from 2005 to 2010 (pdf, 31 pages), Bureau of Justice Statistics Special Report, April 2014, NCJ 244205.

2 “Does the U.S. Spend $80 Billion a Year on Incarceration?” Committee for a Responsible Federal Budget. N.p., 23 Dec. 2015. Web. 09 May 2017.

3 Dory, Cadonna. “Society Must Address Recidivism, Officials Say.” USC News. N.p., 11 Nov. 2009. Web. 09 May 2017.

4 Abuse, National Institute on Drug. “What Are the Unique Treatment Needs for Women in the Criminal Justice System?” NIDA. N.p., Apr. 2014. Web. 09 May 2017.

Bankers: “Beeline Virtual Assistant”

“Beeline Virtual Assistant”

Frustrated with learning how to use your new Vendor Management System?

Many users have experienced the frustration of adapting to new technology, often the interface is not user friendly and it is extremely difficult to learn and/or use the product efficiently. The difficulty of users adapting to a new technological software has explicit implications, such as discouraging user effectiveness and slowing down productivity. To combat this issue, Beeline, a global leader in software solutions for sourcing and managing the extended workface, has come up with a solution that will allow current users and new users of its Vendor Management System (VMS), to navigate and execute tasks effortlessly, easing the adaptation of the system.

Beeline is here to help!

To improve the ease of navigating through its VMS software, Beeline, has recently launched its Beeline Assistant software, which employs deep learning technology through its proprietary Automated Talent Ontology Machine (ATOM). The Beeline Assistant augments traditional user interfaces for many common task, applies automatic speech recognition and natural language understanding to infer users’ needs, collects information, and executes tasks. Through its virtual assistant product, Beeline plans to do away with complex user interfaces, replacing them with effortless, natural language conversations between humans and technology. The virtual assistant, through simple conversations, can assist users with talent development, answer questions about workforce trends, or collect information. One interesting fact about this product is that the brain behind the assistant grows smarter with each interaction, as it becomes aware of each user’s verbal gradations, thus ensuring effective communication with each conversation.

Market & Comparable Product Analysis

Analyzing the competitive landscape for Beeline’s Virtual Assistant product, Fieldglass, a company known for its vendor management systems, recently launched its SAP Fieldglass Live Insights product, which encompasses machine learning technology to provide on-demand insights on the talent market, quick decisions on strategic initiatives, and strategic solutions to optimize performance. Although this product uses a form of augmented intelligence, it serves a completely different purpose in comparison to Beeline’s Virtual Assistant program. The SAP Fieldglass Live Insights program is designed to reduce the time needed to make critical business decisions, by providing on demand market data and solutions to key business initiatives. Scoping out the market, I think Microsoft’s Briana and Nuance’s Nina are good comparables for Beeline’s Virtual Assistant software. Briana and Nina are both virtual assistants that communicate directly with humans to complete various tasks, and each interaction improves the functionality of the software.

Brainasoft Reviews-Android Google Play


The data for the Brainasoft PC download was limited, so we decided to use the data from the Brainasoft app, which allows a user to control their PC remotely, by turning the user’s Android device into an external microphone. The success of the app is evident, with 79% of the customers rating the app as outstanding. The most common complaint from user who rated the app poorly was the fact that the app could not work offline (Wifi is required) and that users find it difficult to type on their computers remotely due to a spacing issue.

Nina-Nuance Communications’ Intelligent Virtual Assistantis designed to delivered an intuitive, automated experience by engaging customers in natural flowing conversations via text or voice. To evaluate the success of Nina, we created a scatterplot to show the revenues/profits of the firm after Nina was launched. Voice Biometrics and the Nina software falls under the Enterprise division of the Nuance business. Nina was launched in 2012 and additional versions in 2013.

Enterprise Solutions

  • Voice Biometrics (Voice recognition, fingerprint recognition, eye scans, and/ or selfies)s
  • Virtual Assistants (subset of voice biometrics-Nina)


  • The dips in revenue are due the changes in the company’s business model, in which the company is focused on increasing its concentration of revenue from on demand, term-based, subscription or transactional pricing models and decreasing revenue from perpetual license models.
  • In 2013, the business also invested in improving its multi-channel customer service options, and launched Nina Mobile and Nina Web.

 Product feasibility & Recommendations

According to Goldman Sachs’ Profiles in Innovation research report, the ability to leverage artificial intelligence technologies will become a major attribute of competitive advantage across all industries in the years to come. In addition, the report stresses that management teams that do not focus on leading in AI and benefitting from the resulting product innovation, and labor efficiencies risk being left behind. Given the need for companies to improve efficiencies, increase productivity, and cut down on wasted time, I believe that Beeline’s Virtual Assistant product will be well received among its present and future customers. Based on the research report, Goldman expects to see continued innovation in data aggregation and analytics driving improvements in AI-powered Digital Personal Assistants. Analyzing the performance of Brainasoft (private company) and that of Nina (Nuance Communications), I think the Beeline Assistant product will be profitable for the firm and can potentially lead to increased demand from companies switching from other vendor management software providers. As far recommendations for the product, I think Beeline should make sure that the natural language processing capability is crisp and can accurately decode requests without any distortions caused by users who may have strong accents.


Team members
Nadia Marston
Nobuhiro Kawai
Lisa Clarke-Wilson
Jose Salomon

Sources:

  1. https://spendmatters.com/2017/04/27/beeline-makes-another-leap-new-world-augmented-intelligence-beeline-assistant/
  2. https://www.beeline.com/press-releases/beeline-announces-industrys-first-virtual-assistant-to-help-clients-source-and-manage-their-non-employee-workforce/
  3. http://www.nuance.com/omni-channel-customer-engagement/digital/virtual-assistant/nina.html
  4. https://play.google.com/store/apps/details?id=com.brainasoft.braina&hl=en
  5. https://www.scribd.com/document/334842852/Goldman-Sachs-AI-Report


Team Awesome: PredPol – hoax or the future of crime prevention?

The problem: violent crimes on the rise in U.S. cities

Crime rates have remained steady or even decreased in major metro areas across the U.S. in the last decade. However, violent crimes have increased over the same time period. Social and political pressures around law enforcement reform continue to mount across the country, forcing police departments to focus on reducing violent crime rates while limiting police force discrimination.

As a trend, crime tends to proliferate in areas where it has successfully been carried out previously1. Furthermore, the severity of crime tends to escalate in those areas. In a neighborhood where an individual can get away with graffiti, the next crime may be theft or burglary, and so on. Increasing staff and patrols is not a scalable measure. In order to more efficiently prevent crime rather than react to it, police departments are turning to data.

Solution: predictive policing

Predictive policing has emerged as a method to leverage data in order to predict locations where crime is likely to occur. Through a machine learning algorithm, it takes past crime data and identifies people at risk socially, as well as areas where crime is more likely.

Source: http://www.sciencemag.org/news/2016/09/can-predictive-policing-prevent-crime-it-happens

One of the most dominant companies in the predictive policing space is PredPol2, a private predictive analytics service that takes data from a local department and uses a machine learning algorithm to produce a daily output of predicted future crimes. The aim of predictive policing is not necessarily to predict the type of a crime, but to predict the location and time it will occur. The goal is to allow individual departments to position police in the best locations to discourage localized criminal activity.

How does it work? First, PredPol takes several years of data to lay a background level of crime activity and map data across the local area. This is done using an Epidemic Type Aftershock System (ETAS), similar in concept to the way scientists predict earthquakes. PredPol takes data from a police department’s Record Management System (RMS) daily to collect information and inform the algorithm. According to the PredPol website, they use three key metrics: date/time, location and crime to predict the location and time of future crimes. This translates into a report with pink boxes indicating areas with high potential for crime that police should patrol.

PredPol “Pink boxes” of high traffic crime areas. Source: PredPol.com

Effectiveness

PredPol cites anecdotal successes such as a 20% reduction in crime in LA over the course of a calendar year. However, it is difficult to validate such claims. Because the algorithm is proprietary, outside academics and data scientists are unable to provide accurate assessments. The RAND report is the most comprehensive third party review to date of predictive policing, and concludes that the impact of predictive policing is lukewarm at best. In fact, preliminary results show that with increased predictive power there are diminishing returns.

One of the issues with understanding its effectiveness is it is unclear what the benchmark for success should be. As one article cites, it could be argued that what PredPol actually predicts is future police activity3. Without reliable proof of causation, we are left with doubts as to whether PredPol actually reduces crime, or if its predicted police movements coincide with activities that would have occurred anyways.

Challenges and proposed alterations

Two primary challenges face PredPol, and organizations like it. The first is proving that the algorithm actually helps businesses fight crime. More academic research from institutions with the ability to effect randomized control trials needs to be developed. One proposed solution would be to measure changes in police behavior during idle times3, i.e. when they are not on patrol or responding to a call. If PredPol’s pink boxes encouraged them to patrol an at-risk area they would have otherwise missed, then it may be easier to measure effectiveness in a controlled setting.

Second, the organization needs to provide evidence that it does not encourage racial profiling. While in marketing materials, PredPol makes soft claims that it is unbiased, by its very nature it is bringing further focus on black and brown neighborhoods. This may further encourage racial and social bias of police officers through confirmation.

References

  1. http://www.sciencemag.org/news/2016/09/can-predictive-policing-prevent-crime-it-happens
  2. http://www.predpol.com/results/
  3. http://www.slate.com/articles/technology/future_tense/2016/11/predictive_policing_is_too_dependent_on_historical_data.html
  4. http://www.economist.com/news/briefing/21582042-it-getting-easier-foresee-wrongdoing-and-spot-likely-wrongdoers-dont-even-think-about-it


Women Communicate Better: Spotify

The Problem

Recommending music without user data is referred to as the ‘cold-start problem’ and is exactly the problem that Spotify wants to solve. This problem arises because it’s nearly impossible to recommend new and unpopular music because by definition, that type of music lacks usage data to base recommendations off of. Spotify wants to be able to introduce people to bands and songs they’ve never heard.

Spotify’s Algorithm

Spotify uses “Collaborative Filtering” to identify users with similar musical taste in order to recommend new music. Basically, User 1 listens to two Justin Bieber songs, also loves the new single from Justin Timberlake, and stores them all in their “Justin^2” playlist.  Then, if User 2 also enjoys the same two Bieber songs, the Collaborative Filtering will recommend the new J.T. single to User 2.

The next step comes from a music analytics startup that Spotify acquired called Echo Nest. The Machine Learning from Echo Nest goes above and beyond matching playlists or preferences. The program reads the articles about music and attempts to quantify the descriptions of new music in a way that allows Spotify to bucket songs and artists, and then recommend them to users. This process (Natural Language Processing) is also used to read the titles of billions of user-generated playlists and categorize the songs by the user-generated titles. Using these buckets from the music press and user playlists, Spotify then creates a “taste profile” or a mix of which categories of music the user most enjoys, and their magnitudes.

Spotify also uses deep-learning on actual audio files. Some attributes of music are easier to find from audio files, like which instruments are used or how fast the beat goes, while other attributes are harder to identify through listening, like genre and age of songs.

These computer generated inputs to the recommendation algorithm are also filtered by some human editorial limits. For example, certain genres like white noise albums are filtered out, and they turn off the Christmas music after…well, Christmas. These guardrails keep the algorithm from making understandable but annoying mistakes.

Effectiveness of Spotify

Spotify’s effectiveness is evidenced by the fact that in March 2017, the company hit 50 million paid subscribers as well as 100 million users.  In comparison, Apple Music has 20 million subscribers, Tidal has 3M and Pandora has 4.5M.  This indicates that Spotify’s features, including selecting specific songs, downloading music, playlist curation and lack of advertisement has been wooing users to the site and converting them to paid users.  

The ability to purchase and afford musical content will continue to challenge Spotify, as it has for Netflix, in order to have music that users want to listen to.  This is where Spotify’s “Discover Weekly” or “Daily Mix” can continue to attract users with new music that has lower acquisition costs.

Improving Spotify

While Spotify has an advanced machine learning based algorithm, there may be opportunities to use human-machine interactions to improve the algorithm. They already leverage their human network by identifying early adopters to source their “fresh finds” playlist, and this approach can be expanded more broadly to other curated content across the site. Similar to Pandora, which uses more human sensor input. The musicology team at Pandora developed a list of attributes like “strong harmonies” and “female singer” and human sensors graded these inputs. The limitations of these human sensors are obvious, but Pandora failed when it was unable to transition from radio and recommendations to providing on-demand plays of specific songs.

There is also potential for music video integration in the same vein as YouTube’s new video curated playlists. Spotify could look to pool a library of music videos and pair them with song selections or curate specific video recommended lists based on a newly developed algorithm. There is also the potential to incorporate voice recognition, which has already been piloted by Amazon Unlimited through Alexa. Voice recognition could provide valuable integration with voice recognition software and hardware from Google home to Microsoft’s Cortana for more on demand searches. With many new technology services from voice to video emerging, Spotify has the opportunity to build out unique video and voice experiences within its platform to drive a more extensive music platform for its customers.


Sources:

http://benanne.github.io/2014/08/05/spotify-cnns.html

https://www.forbes.com/sites/quora/2017/02/20/how-did-spotify-get-so-good-at-machine-learning/#2142872f665c

https://qz.com/571007/the-magic-that-makes-spotifys-discover-weekly-playlists-so-damn-good/

https://www.slideshare.net/MrChrisJohnson/from-idea-to-execution-spotifys-discover-weekly

https://techcrunch.com/2017/03/02/spotify-50-million/


By: Women Communicate Better (Chantelle Pires, Emily Shaw, Kellie Braam, Ngozika Uzoma, David Cramer)

Wear – Final Pitch

Wear


The problem

When it comes to apparel, there are adventurous and conservative shoppers. Adventurous shoppers spend hours researching, browsing, experimenting, and trying on different styles of fashion, and have fun doing it. Conservative shoppers just want to occasionally purchase slightly different hues of the clothes they have worn for years, and the idea of shopping fills them with dread. They like to stick with the familiar because they often cannot visualize how different styles of clothes can look. The problem is often not that these shoppers are unwilling to wear different apparel, but that they are unwilling to put in the search costs. The unwillingness to experiment constrains the growth the $225bn apparel market and contributes to a fashionably duller world and opens up an opportunity for us.


Wear – The solution

The team proposes an augmented judgment system that uses a shopper’s non-apparel preferences to predict apparel preferences that they may not be aware of. For example, if [Wear] knows that a shopper likes James Bond movies, enjoys wine tastings, drives a Mercedes, spends 45 minutes every morning for personal grooming, and prefers to eat at Grace, it would predict the type of apparel the shopper would like through a model that connects non-apparel preferences to apparel tastes. [Wear] would then remove apparel styles already owned by the shopper from the output to form a set of recommendations of new styles the shopper may like. This model will use augmented perception techniques to understand different parts of the user’s environment that provide insight into their preferences. The algorithm will form user’s profile by sourcing user preferences from three key sources: 1) user’s social media accounts such as their twitter posts and who they follow, facebook event posts, instagram likes, yelp posts etc., 2) current retailer accounts to track their purchase history for apparel as well as apparel purchases like Macy’s, Ticketmaster, eventbrite etc., and 3) direct self data input by users, such as color choices of their current wardrobe, size/fit preferences, and category of recommendations needed (t-shirts, jeans, etc.). The result would be distinct from that produced for a shopper who likes Mission Impossible movies, enjoys dive bars, rides a Harley Davidson, spends 5 minutes on personal grooming, and prefers to eat at Smoque BBQ. The algorithm will generate apparel recommendations that fit the needs and preferences of shoppers who may not understand their own preferences, leading to higher consumer willingness to purchase new apparel and higher industry sales.


Typical user profile

Our target user market is 18-35 year olds (millennials) who are tech savvy and fashion conscious. We are targeting all income brackets and both men and women. In total, we expect our target addressable market to be 75 million users.


Use cases

Common use cases that we expect are: users shopping for themselves or for a gift for someone else either for a special event or as part of their routine shopping, for example to replenish one’s closet before a new year at school. The platform would allow the user to make choices on what they intend to do, and what they are looking for (like, a particular type of clothing item), and how far out of their comfort zone do they want to go. We define it as filling the gaps in the closet or extending the closet by being adventurous.


Business model

We plan to launch our platform first with big department stores like Nordstrom, Macy’s. The reason being that 1. [large department stores] already have lot of user data which gives [Wear] a good starting point, 2. they are investing in boosting their digital sales and 3). They are facing intensified competition from various international brands. We plan to then leverage the success and connect our platform with international brands. The users will get the recommendation based on algorithm and also links to the department stores where that particular item could be bought from. If a sale is activated through our platform then [Wear] gets 3% of the GMV.


In a steady state we expect to generate annual revenue of $190M. This is assuming we penetrate 10% of the $63 billion US clothing market which is serviced through e-commerce channel. The average price of an item is $19, showing that all income brackets are appropriate to target. The average per capita spend on clothing is $978 per year, but our target market spends nearly twice that, at $1,708 per year. Although, our revenue estimate uses all apparel e-commerce as our baseline, but our target customers spend more than average, so this estimate is conservative.


The demonstration

In order to demonstrate the potential success of our platform, we would compare not just the analytical power of our model but also the process that the user currently goes through to purchase new items for his/ her wardrobe. Therefore, for our test users we will have them get recommendations from three sources: select a piece of clothing they want to add to their wardrobe themselves, have a sales agent at a store such as Nordstrom give them a recommendation, and have our product give them a recommendation. For each of the three scenarios, we will test the inputs to the user, and how the user reacts to each of them. For inputs to the user, we will judge what inputs and data sources are used by each of the methods, and what information is actually provided to the user and in what form. We think that part of the reason we are differentiated is our process of asking about the user’s personality outside of their wardrobe, which other sources often may not. On the output side, we will judge the user’s reaction in terms of what they thought about the efficiency and convenience of the process, whether they end up purchasing the recommended apparel, and whether they valued the experience enough to return/ recommend it.


The funding

We are looking to raise $750k at this stage. These funds will be used for building the product MVP, acquiring 500k users and one big department store as customer by Q4 2018.

Sources:

https://www.statista.com/topics/965/apparel-market-in-the-us/

https://my.pitchbook.com/#page/profile_522553643

Aerial Intelligence Response

In the event of natural disasters, aid delivery and disease prevention are inefficiently delivered due to lack of information. We use drone imagery and predictive analytics to plan aid delivery efforts and prevent outbreaks following natural disasters

In 2015, there were 376 natural disasters that registered resulting in $70.3B in damages, which is actually below the 10-year trailing average of ~$160B.[1] In addition, these disasters can result in slowed economic growth due to loss of infrastructure, productivity decreases, labor supply losses etc. bringing total average yearly cost to ~$250-$300B[2]. While the overall number of disasters has been trending up, flooding is the most common natural disaster over the last 20 years accounting for ~45% of total natural disasters recorded. On the other hand, storms tend to have the costliest immediate impact (See Figures 1 & 2)[3].


Despite these enormous costs, the distribution of aid is relatively inefficient to this day, which causes more costs to be incurred than is needed. For example, during the earthquake in Haiti back in 2010 even though there were over 900 NGOs on top of the UN, military, and other organizations who came in to help, aid distribution was severely delayed due to communication gaps, logistical issues with the collapse of infrastructure, and overall coordination[4]. In addition, disaster relief spans not only the initial rescue, medical, food, water, and shelter assistance but also longer term infrastructure rebuilding and potential disease and outbreak mitigation efforts due to population displacement and unsanitary conditions. In the US, we find that the federal government ends up shelling out the majority of funds with states and other organizations following suit, so there is definitely demand for cost reduction.

Modern communication technology has helped in requesting for assistance and mobilizing relief in a matter of hours. However, the task of humanitarian logistics[5] lies with the authorities on the ground which include relief organizations, local governments and emergency services. Humanitarian logistics prioritizes quick response and demand satisfaction over profit as being important parameters while delivering relief. In other words, the right goods should reach the right place, at the right time (within the shortest possible time) to those who need it the most. While disaster preparedness remains a top priority for governments and technology has been incorporated in aid mobilization, research[6] indicates that limited assess visibility and procurement could have helped minimize the impact of Katrina.

Given this assessment, we see two key need areas where we believe that technological advances could be valuable. The first is optimizing aid delivery efforts by generating satellite images of the landscape of an area hit with a natural disaster instead of solely relying on volunteers on the ground to classify damages and other potential risks such as people who are trapped and standing water that could lead to infestation and disease as well as the distribution of the population and water sources to allocate food and water effectively. By acquiring this knowledge quickly and without significant additional human effort, we believe that the government and organizations could more efficiently diagnose how and where to allocate efforts from the get-go. The second need area we identified relates to the long-term costs of post-disaster disease outbreaks. We believe the data generated from the satellite imagery captured during initial relief efforts can also be used as inputs to predict the likelihood of disease outbreaks such as malaria and dengue.

Our product Aerial Intelligence Response uses surveillance data and machine learning to assist with effective disaster response plans and minimize disease outbreaks.

  1. CAPTURE accurate view of the disaster region through drones
  2. This allows agencies to ASSESS immediate impact of disaster. For instance, damaged infrastructure and areas prone to flooding can be instantly identified using machine learning algorithms that compare against
  3. DEPLOY aid and evacuation capabilities based on need and extent of damage.

Using machine learning to improve humanitarian logistics

After a disaster, response teams are short on critical information related to infrastructure, health, and safety.  The first stage in our response plan is to use drone technology to create an accurate map of the affected areas.  Commercial drone systems outfitted with image, infrared, and LIDAR sensors are deployed in order to collect data.  A single drone is able to survey approximately 3 acres of space per minute, meaning a fleet of 100 drones would be able to scan an area approximately the size of the city of Chicago in just 8 hours[7].  Open source flight planning and autopilot technology allows for the simultaneous deployment and monitoring of the drones at an extremely low cost[8].

Following this survey, the data collected by the drones is uploaded to a cloud-based storage system, and processed into an orthorectified, multi-layered map.  This process takes place using several computer vision algorithms such as keypoint detection for image stitching[9], and Structure from motion (SfM)[10] for creating three-dimensional maps from two-dimensional images.  The map data can be viewed in a browser-based tool in order to assess the situation or annotate the images with additional metadata.

Once a complete survey of the affected area has been generated, machine learning algorithms are used to automatically identify key points of interest in the data such as infrastructure damage and equipment.  This helps responders plan for and optimize the distribution of aid.  These algorithms can also classify natural features of the landscape such as homes, vegetation, and areas of flooding.  These data are then used as inputs to forecasting models for predicting future disease outbreaks.

From a technical standpoint, the machine learning algorithms used to automatically classify the drone survey data are a class of deep learning models called convolutional neural nets (CNNs).  These CNNs are networks that take in image data as input and generate a pixel-wise classification of the content of the image.  Our approach uses two specific, open source[11] network architectures in order to detect objects and classify the scene.  The first model, used for finding objects such as equipment, vehicles, or infrastructure, is called Faster RCNN[12].  The second architecture, called fully convolutional semantic segmentation networks[13], allow us to take the image and infrared data returned by the drone and generate a map layer displaying where different features of the landscape are located.

After drone data has been captured and analyzed, it is fed into a database which includes data on conditions which may impact the spread of communicable diseases.  Examples include number of inches of rainfall, humidity conditions, and the temperature range by latitude and longitude of the surveyed area. A machine learning algorithm trained on historical data is then used to forecast the probability of the disease spreading through the region. Based on this, the software can populate a heatmap with probabilities and compare to actual infected areas.  This information is critical for groups considering the optimal distribution of resources[14].

Measuring success

AIR will be deployed to state and national governments, WHO, Salvation Army, FEMA, EPA, and American Red Cross, among others, to direct aid efforts better and prevent illnesses from becoming outbreaks by isolating infected areas. AIR’s success will be measured by the improvement in on-the-ground personnel response time, reduction in physical supply waste, reduction in post-event hospitalization rates and time saved in reaching target locations.

The effectiveness of this technology relies on disaster response agencies’ abilities to be tech savvy and willing to learn the technology. Initial database needs to be populated with open source learning libraries and network architectures must be tested to ensure they will be sufficient for timely processing and analysis of the aerial surveys. Government agencies’ openness to change and willingness to steer away from current procedures will also be critical to AIR’s adoption and success.

Funding Ask [Update]

We request $200,000 of funding in order to test and build the survey-classify-annotate model and build partnerships with potential client organizations. 

This will enable our venture to fund:

    • Contract UAV aircraft and pilots
    • Cloud server space
    • Commercially available software
    • Travel expense

References
[1] http://reliefweb.int/report/world/annual-disaster-statistical-review-2015-numbers-and-trends
[2] https://www.forbes.com/sites/marshallshepherd/2016/05/12/weather-caused-90-of-natural-disasters-over-the-past-20-years-and-impacted-the-global-economy/#6c749862671d
[3] http://www.emdat.be/
[4] http://insidedisaster.com/haiti/response/relief-challenges
[5] http://ac.els-cdn.com/S1877705814035395/1-s2.0-S1877705814035395-main.pdf?_tid=e4a518c0-329f-11e7-857a 00000aacb360&acdnat=1494104977_e7dfa68e900fa0e247d652699d678027
[6] http://transp.rpi.edu/~HUM-LOG/Doc/Vault/katrina1.PDF
[7] http://cmemgmt.com/surveying-drone/
[8] https://pixhawk.org/modules/pixhawk
[9] https://en.wikipedia.org/wiki/Image_stitching
[10] https://en.wikipedia.org/wiki/Structure_from_motion
[11] https://github.com/rbgirshick/py-faster-rcnn
[12] https://arxiv.org/pdf/1506.01497.pdf
[13] https://people.eecs.berkeley.edu/~jonlong/long_shelhamer_fcn.pdf)
[14] https://wwwnc.cdc.gov/eid/article/13/1/06-0779_article

HiPo! – Final Presentation Pitch (Ex Machina Learners)

The Problem and the Opportunity

The current college admissions process is flawed. Despite the best efforts of admissions officers to build diverse student classes that have high potential for success, there is little proof to suggest that current application review processes are robust and result in ideal class compositions. A 2006 study by Simonsohn showed that admissions application reviewers weighted the social aspects of an application (e.g., leadership) more heavily than other attributes (i.e. academic factors) on days that were sunny. This worrisome finding demonstrates the outside factors that can affect a human’s judgement and have significant impacts on prospective students’ lives.

A 1996 empirical study conducted by a political scientist at Northwestern University found that the likeliest determinants of admission to college were the standard test scores, grades, and personal information that could be found in one’s application – not the unique, signal characteristics admissions officers claim to look for in essays and interviews that could lead an officer to make a more complete evaluation of the candidate. Perhaps even more worrisome is that admissions offices, outside of those at some of the top universities, do not evaluate the outcomes of application decisions – such as the success of an admitted student or the future financial benefits to the institution of that student’s acceptance – and incorporate that feedback into their admission evaluation criteria.

In addition, the application review process at most universities is still largely manual, requiring admissions officers to read, evaluate, and discuss tens of thousands of applications multiple times each year. The significant time spent on even the most clear-cut of cases (either acceptances or denials) . In a University of Texas study of how a machine learning solution could aid PhD application review processes, it was observed that reviewers spent over 700 hours reviewing a pool of 200 applicants. Now, consider that many of the top universities receive tens of thousands of applicants.

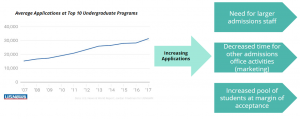
Therefore, we see a clear opportunity for a machine learning-based solution to address the existing flaws in the college admissions process. Not only is there a large capturable market with over 3,000 institutions of higher education in the U.S. that all face this admissions evaluation issue, the number of college applications continues to increase, which will only exacerbate the issues described above.

Our platform, HiPo!, will help provide significant time and human resource savings to university admissions offices. In addition, it will be trained using historical application and student performance data to help admission officers optimize their admissions evaluation process across a number of outcome-based factors (e.g., future earnings potential, yield likelihood, philanthropic giving potential).

The Solution

The proprietary algorithm will utilize a semi-supervised machine learning model. The supervised elements that the model will optimize for are the quantifiable outcomes such as future earnings potential, yield likelihood, and philanthropic giving potential. However, given the vast expanse of data that the model will be trained on through years of qualitative data from student essays and interview transcripts, there are other elements that, in an unsupervised way, the algorithm can make associations and clusters from to derive additional predictive value. These elements are not as measurable such as creativity or diversity of thought – both things that an admissions committee would value in a class. However, over time if the algorithm can add additional measurable information to admissions officers on these dimensions, they would provide additional evaluative data.

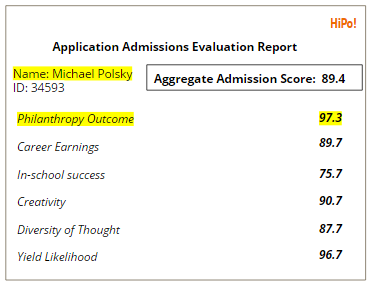
The inputs into the core product are traditional quantitative metrics, such as GPA, standardized testing scores, etc., in addition to qualitative inputs such as essays, interview transcripts, recommendations, and resumes. HiPo! recognizes that each institution may have a different idealized student profile, and these may even vary across different types of programs at that institution (e.g., law school vs. business school vs. undergrad). By creating a robust feedback loop by measuring the success of various students over time based on the HiPo! evaluation criteria, the algorithm will be able to estimate outcomes and provide admissions officers with quantifiable score reports:

This is merely a prediction of the relative likelihood of future outcomes based on historical results of similar profiled candidates (out of 100), not a pure measure of an individual’s current attributes.

Empirical Demonstration

To validate the effectiveness of the machine learning algorithm and to validate the hypothesis that certain characteristics and patterns present in an candidate’s application, essays, and interviews are reflective of future outcomes, the HiPo! team would perform a demonstration pilot by partnering with an institution of higher education, such as the University of Chicago Booth School of Business. HiPo! would collect historical applicant records from 1950-1992. 75% of this data would be randomly selected to train the algorithm, under the supervised and unsupervised learning methods described above. The algorithm would then be applied to the remaining set of the data. The predictive output of the solution would be measured against actual outcomes of the students evaluated in the sample. For instance, if Michael Polsky MBA ‘87 was evaluated as part of the sample, a successful algorithm would predict that he would have both high career earnings potential and strong likelihood of philanthropic behavior.

Following this initial demonstration, HiPo! Will undergo a more substantial pilot with multiple institutions, focused on optimizing the algorithm for one specific academic program (e.g., MBA) and the ability to “flex” parameters in its algorithm based on institutions’ desires.  With highly competitive MBA programs constantly measuring themselves against one another while jockeying for rankings and admitted students, hitting specific metrics (e.g., yield) and demonstrating students’ program-driven success is critical.  During the pilot, HiPo! will work with each involved university on the types of class profiles the school hopes to optimize for in its admissions process; one institution may hold social impact as a core component of its mission, while others may want a stronger profile of entrepreneurship. Increasing the repository of data from diverse unbiased sources will even further strengthen the algorithm’s predictive ability to even further tailor the solution to individual clients.

Risks and Mitigants

There could be push back from universities who are concerned that its applicants will be able to “game the algorithm” by using targeted keywords and language in essays to increase the likelihood of recommendation by the engine.  However, we assume institutions will operate in their best interests to keep their algorithm highly confidential, preventing this from ever becoming a risk in the first place.  In addition, this is easily mitigated through continuous learning and updating of the algorithm. In fact, many students are already attempting to “game the system” in their essays anyway through targeted language throughout their application to catch the eye of admissions staff.  

Finally, we see a potential risk with institutions ignoring the mission of HiPo! as a complementary tool to assist admissions staff, and instead relying exclusively on it to make admissions decisions.  We strongly discourage completely removing the human element from the decision process.

Funding Request

To build the platform that will be used for the demonstration pilot described above, HiPo! is seeking a $200,000 investment that will be used to hire technical development staff. This number is based on the anticipated salary needs for 2-3 full-stack developers and machine learning experts for a period of 6 months. We anticipate also using these funds to prototype our data management system that will be used to house both historical and customer data that will serve as inputs into the machine learning algorithm.


Sources

Cole, Jonathan R. “Why Elite-College Admissions Need an Overhaul.” The Atlantic. Atlantic Media Company, 14 Feb. 2016. Web. 13 Apr. 2017.

Estrada-Worthington, Rebecca, et. al.  “2016 Application Trends Survey Report”.  Graduate Management Admissions Council. 2016. Web. 1 May 2017.

Fast Facts. N.p., n.d. Web. 13 Apr. 2017.

Friedman, Jordan.  “Explore College Admission Trends at Top National Universities”.  U.S. News.  22 Sept 2016.  Web.  13 Apr. 2017.

Miikkulainen, Risto, Waters, Austin. “GRADE: Machine Learning Support for Graduate Admissions.” Proceedings of the 25th Conference on Innovative Applications of Artificial Intelligence, 2013.

Simonsohn, Uri. “Clouds Make Nerds Look Good: Field Evidence of the Impact of Incidental Factors on Decision Making.” SSRN Electronic Journal (n.d.): n. pag. 2006. Web. Apr. 2017.