
Back in 2018, our Cytek Aurora was installed and Cytek came to campus for two days to train us on the instrument. It was all very exciting! A short time passed before researchers really started using the instrument and I was asked to design a panel. From what I recalled from Cytek’s training it seemed pretty straightforward – I’d just finished optimizing a 16-marker panel on a conventional cytometer, so I assumed I could just use the provided spread matrix and design panels to minimize spillover using the same methods for panel design on a conventional cytometer. It turns out I was wrong. The Cytek Technical Application Scientist working with me reminded me that they provide a spread matrix, not a spill matrix. Spread and spill are related, but they are not the same! I’ve found that a strong understanding of spreading error is incredibly helpful for designing and checking panels for the Cytek Aurora.
Before I get into the details, I’ll show you an example of how spreading error can affect data. Figure 1 shows an example from our instrument – these two plots show two tubes that were stained concurrently and only differ in the fluorophores used to stain the cells. Figure 1A is was stained with only a BV785 antibody, whereas Figure 1B was stained will all 14 markers in the panel, including the same BV785 antibody. Figure 1A shows that the BV785 marker has a clear positive and negative population. However, in Figure 1B the addition of 13 fluorophores to the panel has caused the BV785 positive population to be difficult to gate. In other words, the spreading error from at least one of the 13 other fluorophores in the panel has significantly decreased the resolution of the BV785 marker. A strong understanding of spreading error will help you avoid this problem and allow you do attain high quality data!
What is the difference between spill and spread?
Spill refers to when one fluorophore spills into the detector assigned to another fluorophore. In conventional flow cytometry, we often say that the emission spectra of APC, for example, spills into the detector assigned to Alexa Fluor 700 (Figure 2). And if we apply compensation, we “fix” this spillover. For spectral cytometry spillover does still occur because there are multiple fluorophores emitting in each detector, but saying that fluorophore 1 spills into fluorophore 2 doesn’t really make as much sense as it did for conventional flow cytometry because we’ve unmixed the data from multiple detectors.

Spread, known more precisely as spillover-spreading error, refers to an error that is visible after compensation or spectral unmixing has been applied (Figure 3). You’ve probably seen the spreading error in conventional flow cytometry, but perhaps you haven’t paid close attention to it. I’ve heard it called the “umbrella pattern” or the “trumpet effect”. Sound familiar?

Some people may just happily accept that this spreading error occurs (that was how I felt!), but some people may want more information – what exactly is this error and where does it come from? I was asked this question at one point and found I could not provide an answer, so I spent a sizable amount of time trying to comprehend some highly technical papers on the topic1,2,3. As an immunologist and not a physicist, this is what I’ve boiled it down to: Photons are hard to count, so there is some error in counting them and this leads to variability in the data. In particular, it can be tricky to count photons from multiple fluorophores in the same detector. If you would like a more technical answer, feel free to read the references at the end of this post!
As I mentioned, this error occurs in all flow cytometers and is not specific to spectral cytometry. So why are we so concerned about it now? It has to do with the “rules” for when spreading error occurs:
- More spreading error occurs with more fluorophores in the detector
- More spreading error occurs the more a fluorophore spills into another detector
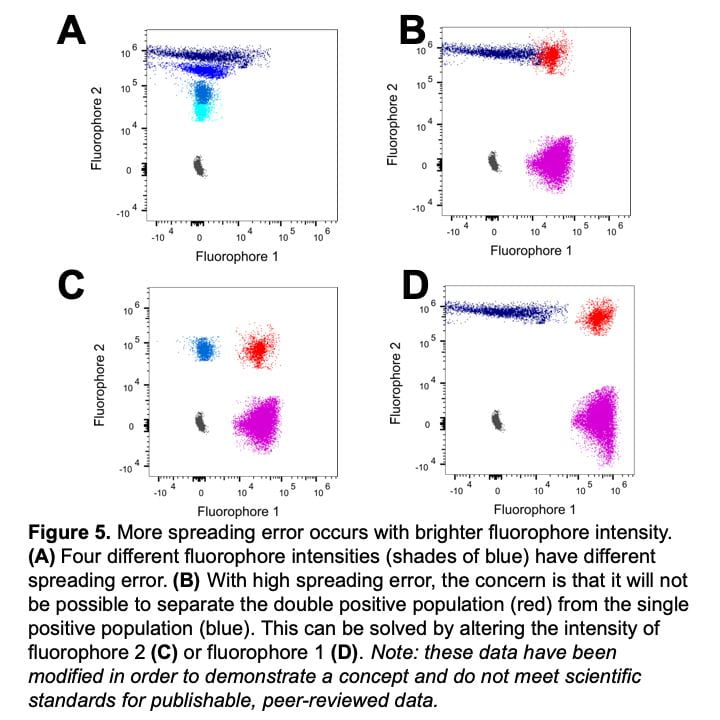
- More spreading error occurs with brighter fluorophore intensity
Most of the aurora users in my core facility are interested in 20-30 marker panels, compared to about 12 markers on a conventional flow cytometer. The first rule explains why spreading error is more of a concern with a 25 marker panel compared to a 12 marker panel. Our current spectral cytometry users have panels with many more fluorophores in each detector, therefore they need to play close attention to spreading error.
The second and third rules are particularly helpful for panel design. But first let me give you a few examples to understand these rules. To explain the second rule, let’s focus on a single fluorophore on a conventional flow cytometer and how it spreads into two detectors. Figure 4 shows a spectral viewer with three fluorophore emission spectra (shown as curves) and two detectors (shown as rectangles). Looking at the PerCP-Cy5.5 emission spectrum (red), we can see that it spills more (the line is higher) into the BUV737 (blue) detector compared to the BUV805 (green) detector. The second rule then explains that the PerCP-Cy5.5 will spread into BUV737 more than into BUV805 because it spills into the BUV737 detector more than the BUV805 detector. This is shown with real data in figure 4B vs 4C by comparing the spread along the y-axis. This information applies to selecting fluorophores for a panel – if options are available, it is better to avoid fluorophores that cause a lot of spreading. For spectral cytometry panels, this means limit usage of fluorophores that are highly similar (cannot be distinguished on a conventional cytometer, such as APC and AF657) if possible.

Figure 5 shows data relating to rule three – more spreading error occurs with brighter fluorophore intensity. In Figure 5A, darker blue populations have higher fluorophore intensity and more spreading error, whereas lighter blue populations have lower fluorophore intensity and less spreading error. In practice, fluorophore intensity can be lowered in two ways: by titrating the antibody/dye to use a lower concentration or assigning the fluorophore to a marker with lower expression. For panel design, this spreading error becomes important when investigating co-expressed markers. Figure 5B demonstrates the problem – the fluorophore 2 positive population (blue) spreads into fluorophore 1, and makes it difficult to resolve the double positive population (red). To solve the problem, changes need to be made to either fluorophore 2 or fluorophore 1. If the intensity of fluorophore 2 is lower (Figure5C), we see less spreading error and the double positive population (red) can be clearly resolved. This can be accomplished by using a lower concentration of fluorophore 2 by performing an antibody titration or moving fluorophore 2 to a lower expressed marker. Alternatively, flurorophore 1 can be moved to a marker with higher expression (Figure 5D). Note that spreading error is problematic for co-expressed markers and is much less concerning for markers that are not co-expressed. Looking back to Figure 4B and 4C, spreading error is not concerning if fluorophores are assigned to separate cell types where a double positive population is not expected.
Applying Concepts of Spreading Error to Panel Design
The last fact to understand about spreading error is that it will always occur and there is no way to “remove” the error. The appropriate way to deal with spreading error is to design a panel around the known spreading error. Additionally, all antibodies and dyes should be titrated in order to minimize spreading error. The most valuable tool for panel design is the spread matrix provided by Cytek. Links to panel design tools and a video tutorial can be found on our resources library (located under the Resources menu and in the module below). Based on all of the information on spreading error above, here are my recommendations for assigning fluorophores to markers:
- Assign highly expressed markers to dim fluorophores and low expressed markers to bright fluorophores
- For panels that have many co-expressed markers, avoid using highly similar fluorophores that cannot be distinguished on a conventional flow cytometer. An example of this type of panel would be one used to examine many markers on a single cell type. This differs from panels that examine a wide variety of cell types.
- For fluorophores that spread significantly into each other (typically pairs that cannot be distinguished by a conventional flow cytometer like APC and AF647), assign them to markers that are on different cell types so that a double positive population is not expected.
- For co-expressed markers, assign fluorophores with minimal spread into each other.
- Note: If there are many co-expressed markers, this may be difficult to accomplish. In this case, a panel check will be necessary to determine if spreading error is problematic or not (see Figure 5B-D for example data).
- How to manage fluorophores that cause a lot of spreading error (many red boxes in the row of the spread matrix):
- Avoid assigning these fluorophores to highly and widely expressed markers. This depends on your experimental question: assigning CD8 to PE-Dazzle594 would be bad if CD8 T cells are of interest, but may be fine if the experimental goal is to examine CD4 T cells but NOT CD8 T cells.
- Assign them to a dump channel (one or more antibodies that remove cells that will not be analyzed, such as lineage). In this case, no cells of interest will have the offending fluorophore(s) and spreading can be ignored. Note: if more than one antibody is used for a tandem dye, you should use biotinylated antibodies in combination with a fluorophore-conjugated streptavidin.
- Assign them to a low expressed or rarely expressed marker. In this case, the spreading will only be an issue for a small number of cells.
- Assign them to a marker that is on a cell subset that does not co-express any other markers in the panel. For example, assign it to a neutrophil marker when all other makers in the panel are expressed on lymphocytes and monocytes.
- How to manage fluorophores that receive a lot of spreading error (many red boxes in the column of the spread matrix):
- Determine the staining pattern of the marker. Is it on/off with clearly defined and separated positive and negative populations like CD4? Is it a continuum like HLA-DR? Is it important to identify low expression of the marker?
- For fluorophores that receive a lot of spreading error, it is best to place a marker with on/off expression. In this case, it is more likely to end up with data that looks like figure 5D where a double positive population can be resolved despite large spreading error. Compare this to figure 5B where the double population cannot be resolved.
Keep in mind that panels that are larger and/or have many co-expressed markers will be harder to design. It’s important to remember that panel design is theoretical and panels should always be tested on actual cells. Detailed information on how to perform a panel quality check and further information and tools about panel design can be found in the Resources library (see the module below).
I understand that panel design for 20+ markers can be intimidating! If you’re at the University of Chicago, don’t forget that I can help you design and troubleshoot your panel. Good luck!
References
- Roederer M. Compensation in flow cytometry. Curr Protoc Cytom. 2002 Dec; Chapter 1:Unit 1.14. doi: 10.1002/0471142956.cy0114s22.
- Nguyen R, et al. Quantifying spillover spreading for comparing instrument performance and aiding in multicolor panel design. Cytometry A. 2013 Mar;83(3):306-15. doi: 10.1002/cyto.a.22251.
- Roederer M. Spectral compensation for flow cytometry: visualization artifacts, limitations, and caveats. Cytometry. 2001 Nov 1;45(3):194-205.
Looking for more Aurora resources? Check out our resource library!


You made this concept quite clear. thank you for your clear explanation.
Cheers.
sudheer.
Thanks for the very comprehensive explanations. But I have a question related to figure 4. How come you see spreading of the PerCP-Cy5.5 fluorophore in the BUV737 detector, since the PerCP-Cy5.5 is excited by a different laser? I don’t expect there is spillover in the detector of the BUV737. Thank you!
Hi GiuliaF,
Good question! PerCP-Cy5.5 is pretty annoying by the fact that it actually gets excited by all of the laser beams on most flow cytometers. So the PerCPCy-5.5 signal will overlap on a number of other markers that you would not necessarily expect, including BUV737. I talk a bit about this in a presentation that we did for ABRF – got to 1:11:05 for that specific slide.
Best regards,
David