Two weeks ago I covered my red flags for identifying bad panel design (read that here if you missed it!). This week I’ll go over my red flags for experiment design, which mostly means controls. Controls are needed to be able to appropriately interpret experiment results. Therefore, if there are problems with the controls, you need to be aware of how the problem affects the data and consider that before making conclusions about the data.
1. Experiment lacks single stain controls.

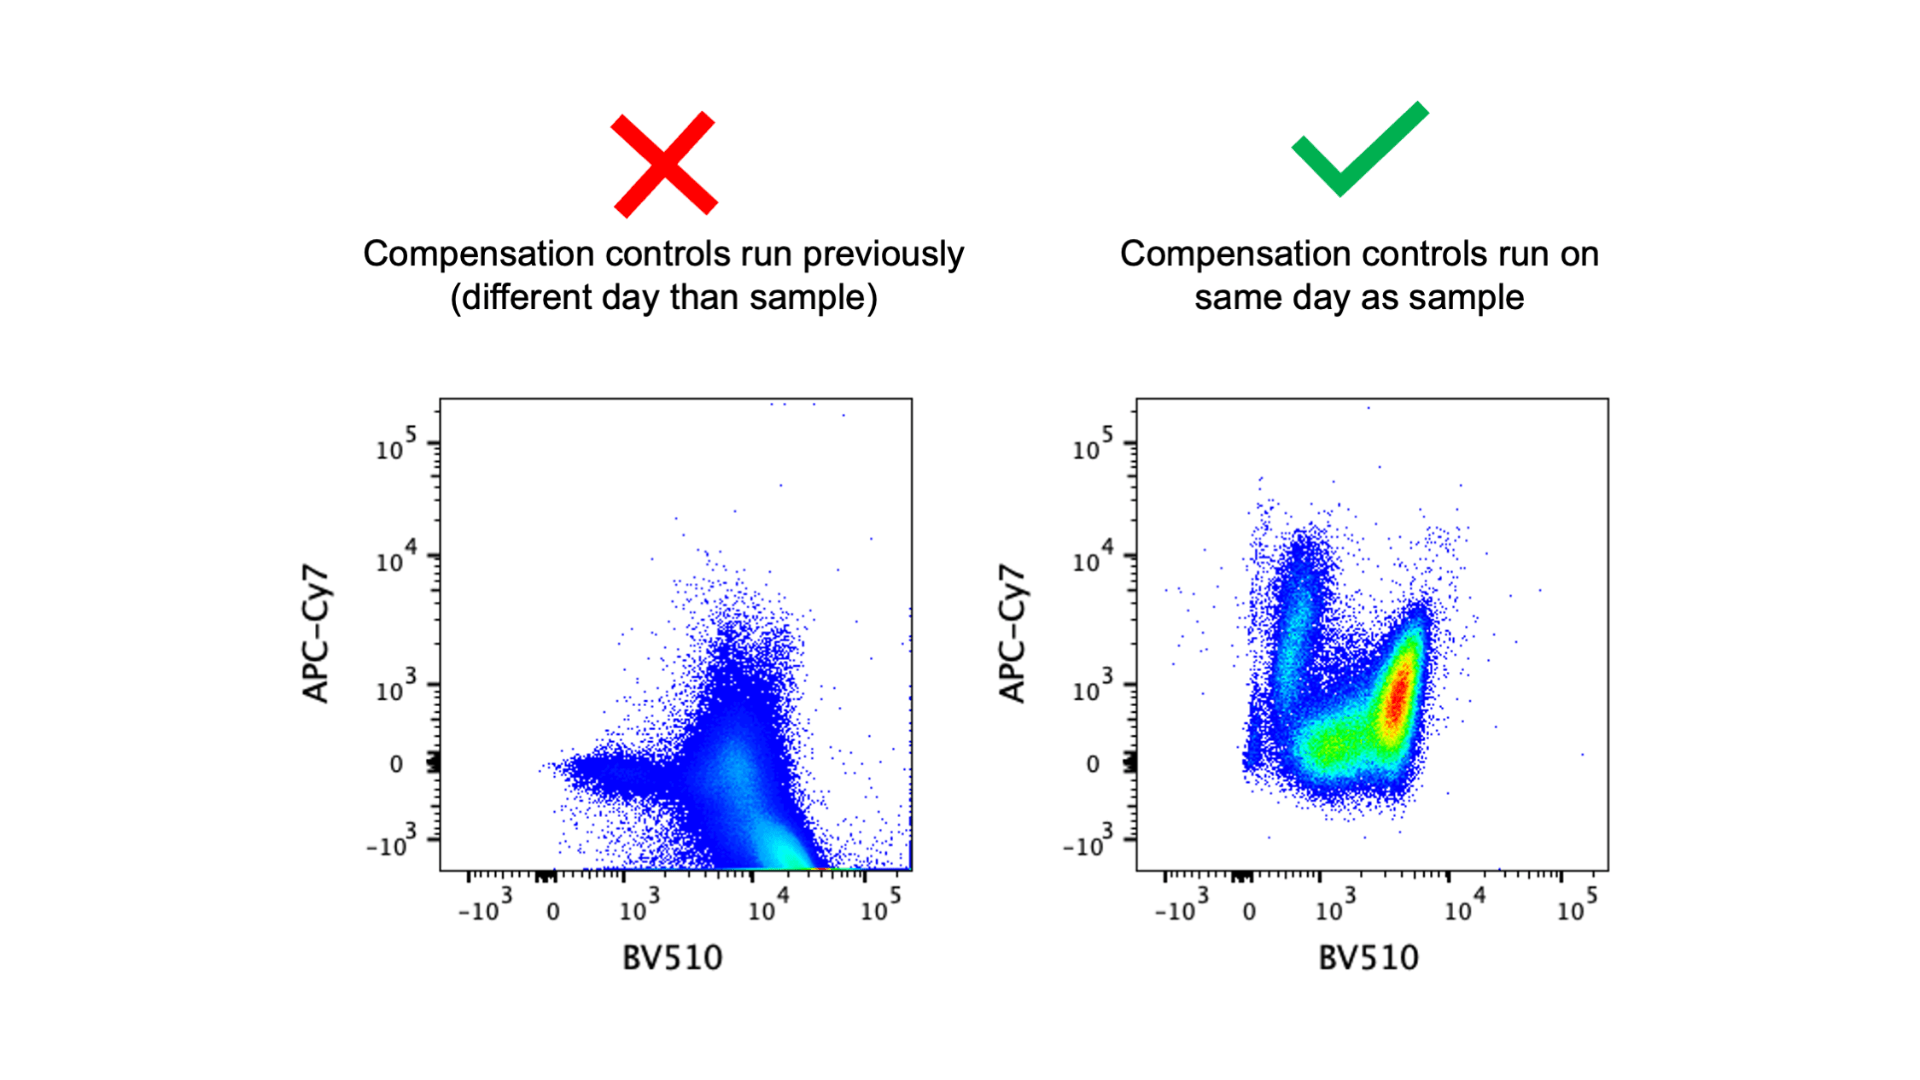
The above image shows an example of two samples with the same panel using the same compensation matrix but stained and run on the cytometer on different days. This scenario would occur when someone runs controls and samples on one day, but then repeats the experiment on another day and uses the compensation matrix from the first experiment instead of bringing new controls. Best practice says single stain controls must be run every single time you run an experiment. From one experiment to the next, there may be variations in the antibody staining, fluorophore stability, and/or instrument stability. These variations could mean that the compensation matrix needs to be different, and the only way to properly create or adjust a compensation matrix is with single stain controls. Unfortunately it’s somewhat common for people to run experiments without controls and apply an old compensation matrix to new samples. I’ll admit that I don’t run controls 100% of the time. But if you’re going to skip the single stain controls you should definitely know that this is not best practice and you should have a very good understanding of the consequences of analyzing data with compensation errors (a future blog post will be dedicated to this topic!). It may be possible to get useable data when reusing old controls, but this should be tested before it is put into practice.
2. Only compensation beads run for single stained controls (no single stained cells).

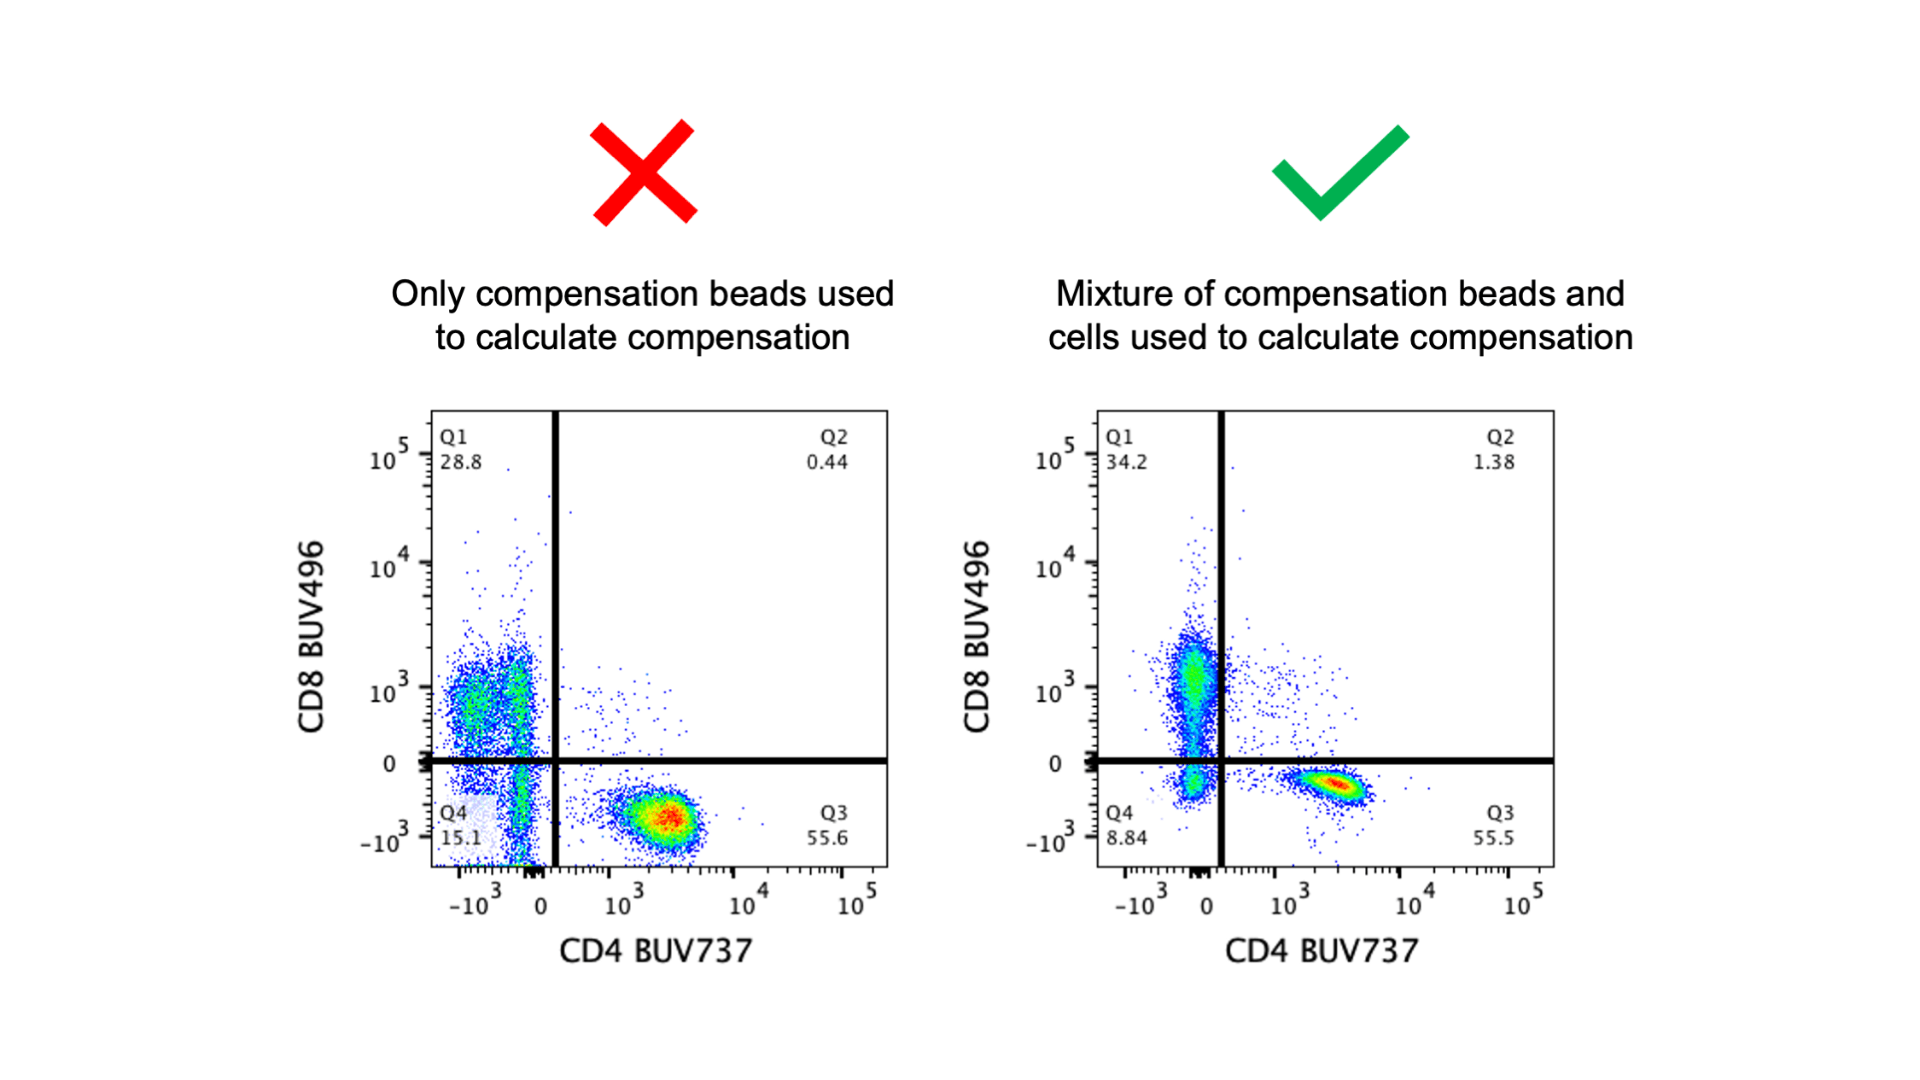
Compensation beads are a great tool and can be very useful if a marker is not well expressed on cells or if there aren’t enough cells to use for both samples and controls. However, compensation beads are not a perfect replacement for single stained cells. For some unknown reason, the emission spectra of a fluorophore is sometimes different if the fluorophore is on a bead vs. a cell. Why? No one has any idea and I’m not sure anyone is trying to figure it out, but it is a known fact (it might be written on the technical data sheet of your antibody). Because of this mismatch in fluorophore signature, that means a compensation matrix that works well on beads might not work quite as well on cells. If compensation beads are used for all single stained controls, you should be on the lookout for compensation errors in your fully stained cells (see the first bad data blog post for patterns to look for).
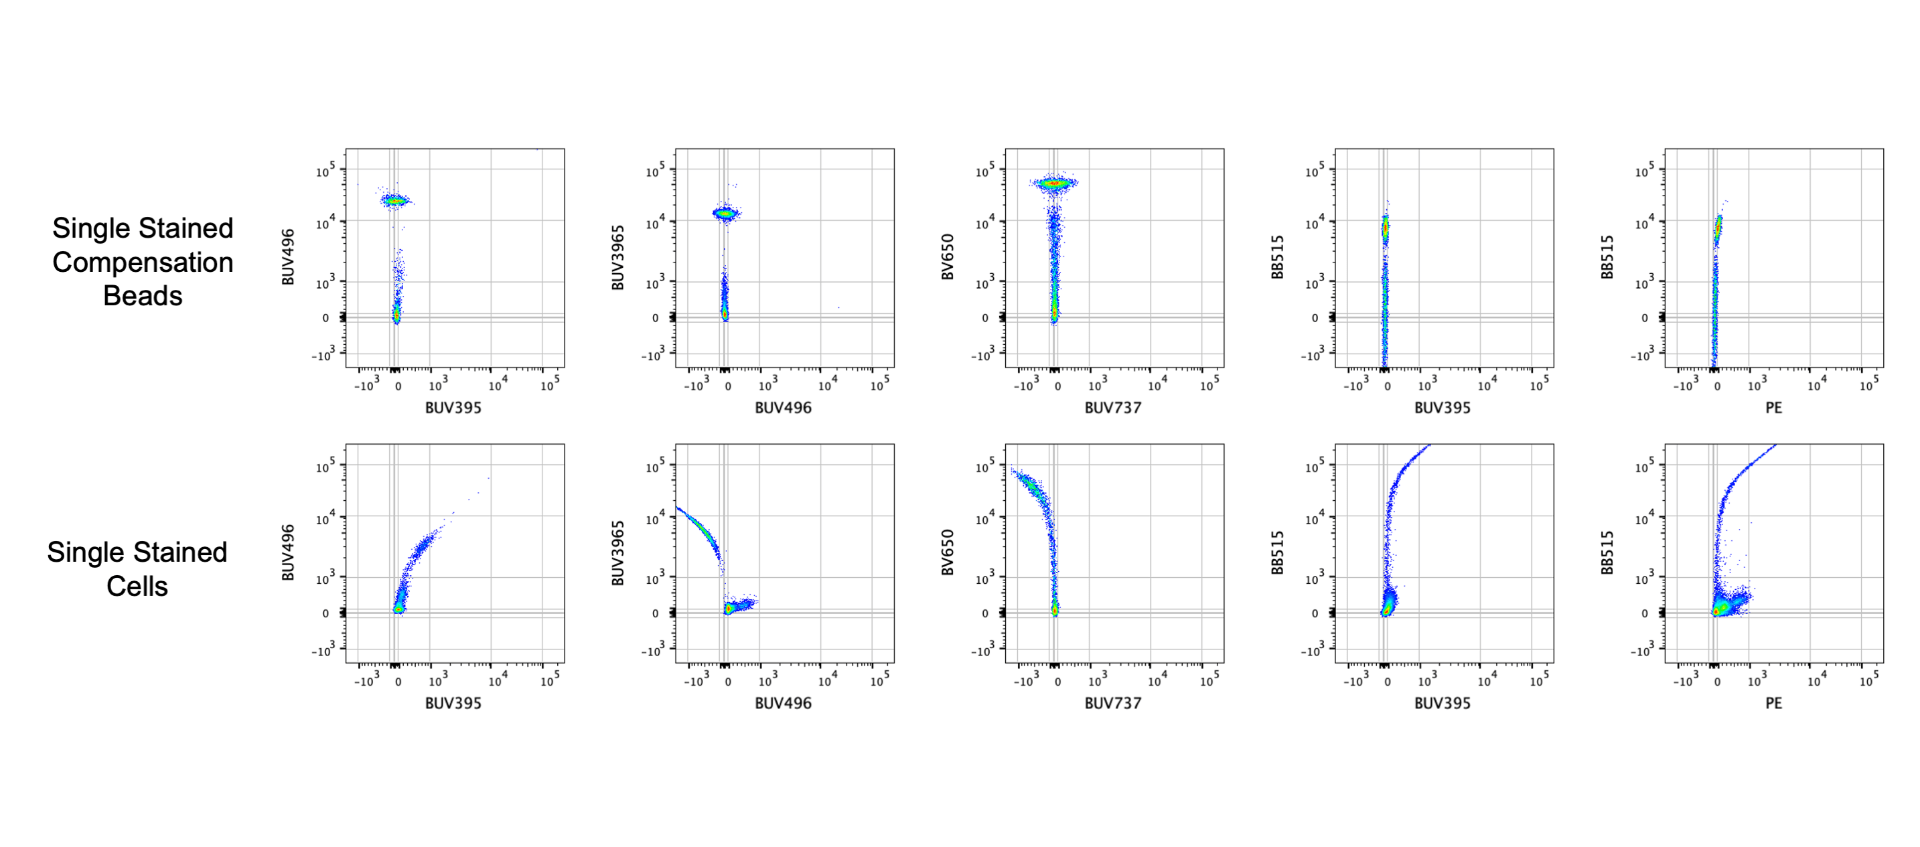
The image above shows the consequences of analyzing data that has unmixing errors because only compensation beads were using to calculate compensation – note how the frequencies of the gates differ. In the image below I have a few plots to demonstrate how the single stained beads for this panel are perfectly compensated but the single stained cells are not. Using only compensation beads is not a guarantee that there will be compensation errors, but it is a possibility. Unfortunately I have not found a reliable way to predict which fluorophores have an altered emission spectra on beads. However, you should check with the manufacturer if your beads have any known fluorophore issues. For example, ThermoFisher’s AbC beads are more likely to have issues with the polymer dyes (BUV, BV, BB, Super Bright) compared to the UltraComp and UltraComp Plus beads.

3. Use of isotype controls instead of FMOs.
Isotype controls were used many years ago to distinguish positive staining from negative staining. However, once fluorescence minus one (FMO) controls were developed, it was determined that this was a much better method for gating positive cells. Isotype controls identify problems with background staining, but don’t account for spreading error from other fluorophores in the panel. (Image credit: Mario Roederer via The Daily Dongle)
4. Unlabeled parameters and/or tubes.
This issue is mainly a pet peeve of mine, but could cause some problems in data analysis. If it were up to me, I would make it a requirement that parameters must be labeled with marker names (CD3-FITC, CD19-PE, etc.) and tubes must contain descriptive labels (WT, KO, treated, untreated, FMO, etc.) before users are allowed to record data. But unfortunately, many users don’t add marker names and leave default tube names (Tube_001, Tube_002, etc.). This may not be a problem if you analyze the data within a week, but chances are that data analysis may be revisited when creating a manuscript many months (or years!) later. Or data may be given to another person to analyze at a later date. Without including informative labels in the FCS files, you’ll have to rely on finding that information in lab notebook and hope that you can (1) find the information and (2) read the handwriting. Labeling parameters and tubes with as much information as possible will ensure that appropriate conclusions can be made from the analysis – FITC+ is definitely CD3+ and the WT tubes are definitely being compared to the KO tubes. For guidelines on annotating datasets I suggest looking into MIFlowCyt and the Probe Tag Dictionary.
I hope you found these tips for spotting the red flags of experiment design useful! If you’d like more in-depth information, you can check out my Flow Basics 2.0 courses – 2.4 specifically covers controls and 2.5 provides instructions for labeling parameters and tubes in BD FACSDiva. This bad data series will be continued, so stay tuned for future posts. Let me know in the comments if you have your own red flags to look for!


Hi Laura! Do you offer consulting on flow design experiments?
Hi Vanessa,
Please email me a brief description and we’ll discuss how to proceed with consultation services! LJohnston@bsd.uchicago.edu
Hello,
I have Th2 ICS panel for mice lungs. When. I gate CD4(PE-CF594) vs CD8 (Percp cy 5.5) the plot looks like this
https://drive.google.com/file/d/1A09LpFHiihSMrNXK89foU6NNjHU5VC-t/view?usp=sharing, is there a problem with compensation?
I have the following colors in my panel
CD45 BUV395
CD3 FITC
CD4 PE-CF594
CD8 Percp cy 5.5
IL-4 APC
IL-5 BV421
IL-13 PE
Hi Fatima,
I’d need to look at your full data set to be absolutely sure of my answer, but this looks properly compensated. I don’t see any obvious issue with this graph.
Hello again,
I have question about whether to use FMO or a biological negative control to use in gating in the panel I have here?
So, I do eosinophils panel on lung cells, and we gate on them after removing neutrophils and based on the expression of Siglec F and CD11c we have two populations. The 1st is expressing SigF+ and CD11C – , and the 2nd is expressing SigF++ and CD11c+ (which I see in inflammation in my model). I attached a picture here. https://drive.google.com/file/d/1uOKmhPuz6cSKGcaWSZuH9JpEBiWDN696/view?usp=sharing
I use CD11c FMO to gate but in my lab suggested to use the negative control to gate on CD11c because I have alveolar macrophages which are highly autofluorescent in the AF488 channels so interfering with my gate. What do you recommend?
I have 4 colors:
BUV395 (CD45), AF700 (Ly6g), AF488 (CD11c), PE (Siglec F)
Hi Fatima,
Unfortunately I won’t be able to provide a good answer to your question without having a discussion with you about your experiment setup and taking a look at the data. If you want, you could email me at ljohnston@bsd.uchicago.edu and we can discuss setting you up with our consultation service.
I can suggest that for future experiments you may find it easier to move CD11c off of AF488 and/or include another marker to specifically identify alveolar macrophages.
Thank you so much! This was very helpful. I have a question about compensation beads. When I run them, I can see 3 or 4 populations of beads with different SSC-A and different brightness. FlowJo always picks the smallest population for compensation. I was wondering if that is always correct or we should pick the population that is closest in size or brightness to our actual cells? Is there any difference between those beads populations?
Hi Faraz,
The comp beads should normally all have the same size and you should only see one group on your FSCxSSC graph. What you may be looking at is this main group, along with clusters of beads clumped together. You can gate on the cluster with the highest percentage – that should be your single bead population – and run your compensation using that group.
Hope this helps!